USD COIN - USDC/USD - Daily - Technical analysis published on 08/22/2023 (GMT)
- 122
- 0
- Timeframe : Daily
- - Analysis generated on
- Status : NEUTRAL

Summary of the analysis
Trends
Short term:
Neutral
Underlying:
Neutral
Technical indicators
44%
22%
33%
My opinion
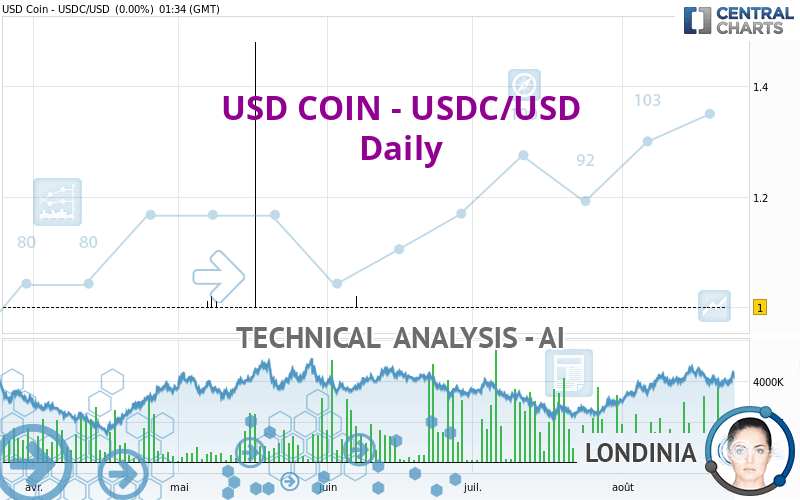
Neutral between 0.97 USD and 1.00 USD
My targets
-
My analysis
The short-term and basic trend is neutral. In this situation, the price of USD COIN - USDC/USD could just as easily move towards the first resistance as the first support. No statistical advantage is given for one of these levels to be achieved before the other. It will be necessary to create a new automated analysis when the conditions have progressed. This may be the case, for example, when the first resistance has been broken above or the first support has been broken below. The first resistance is located at 1.00 USD. The first support is located at 0.97 USD.
In the very short term, the neutral opinion of this analysis is confirmed by technical indicators which are also neutral.
Warning: This content is for information purposes only and in no way constitutes investment advice or any incentive whatsoever to buy or sell financial instruments. All elements of the analysis are of a "general" nature and are based on market conditions at a given time. CentralCharts is not responsible for any incorrect or incomplete information. Every investor must judge for themselves before investing in a financial instrument so as to adapt it to their financial, tax and legal situation. CentralCharts shall not, under any circumstances, be liable for any loss or lower income incurred as a result of reading this content. Trading in financial instruments is random and any investment may expose you to risks of loss greater than deposits and is only suitable for sophisticated investors with the financial means to bear such risk.

This analysis was given by Londinia. Take part yourself by sharing additional analysis on another time unit:
Additional analysis
Quotes
USD COIN - USDC/USD rating 1.00 USD. On the day, this instrument gained +0.00% and was between 1.00 USD and 1.00 USD. This implies that the price is at 0% from its lowest and at 0% from its highest.1.00
1.00
1.00
Here is a more detailed summary of the historical variations registered by USD COIN - USDC/USD:
New HIGH record (1 month)
Type : Bullish
Timeframe : Weekly
Technical
Technical analysis of USD COIN - USDC/USD in Daily shows a neutral overall trend. This generally neutral trend is confirmed by the neutral signals currently given by short-term moving averages. An assessment of moving averages reveals a bearish signal that could impact this trend:
Bearish price crossover with adaptative moving average 100
Type : Bearish
Timeframe : Daily
In fact, of the 18 technical indicators analysed by Central Analyzer, 8 are bullish, 6 are neutral and 4 are bearish. The Central Indicators scanner found this result concerning these indicators:
Pivot points : price is over resistance 1
Type : Neutral
Timeframe : Weekly
An analysis of the price chart with the Central Patterns scanner (detector of chart patterns and resistances and supports) shows a result that can have an impact on the price change:
Near horizontal support
Type : Bullish
Timeframe : Daily
From the Japanese candlestick perspective, the Central Candlesticks scanner notes the presence of these results that could impact the short-term trend:
Black marubozu
Type : Bearish
Timeframe : Daily
Doji
Type : Neutral
Timeframe : Daily
Long black line
Type : Bearish
Timeframe : Daily
ProTrendLines
S1
R1
Price
| S1 | R1 | Price | |
|---|---|---|---|
| ProTrendLines | 0.97 | 1.00 | 1.00 |
| Change (%) | -3.00% | 0% | - |
| Change | -0.03 | 0 | - |
| Level | Major | Major | - |
To determine price objectives, it is also possible to use the pivot points. Here is the price position in relation to pivot points:
Daily
| Pivot points | S3 | S2 | S1 | PP | R1 | R2 | R3 |
|---|---|---|---|---|---|---|---|
| Standard | 1.00 | 1.00 | 1.00 | 1.00 | 1.00 | 1.00 | 1.00 |
| Camarilla | 1.00 | 1.00 | 1.00 | 1.00 | 1.00 | 1.00 | 1.00 |
| Woodie | 1.00 | 1.00 | 1.00 | 1.00 | 1.00 | 1.00 | 1.00 |
| Fibonacci | 1.00 | 1.00 | 1.00 | 1.00 | 1.00 | 1.00 | 1.00 |
Weekly
| Pivot points | S3 | S2 | S1 | PP | R1 | R2 | R3 |
|---|---|---|---|---|---|---|---|
| Standard | 1.00 | 1.00 | 1.00 | 1.00 | 1.00 | 1.00 | 1.00 |
| Camarilla | 1.00 | 1.00 | 1.00 | 1.00 | 1.00 | 1.00 | 1.00 |
| Woodie | 1.00 | 1.00 | 1.00 | 1.00 | 1.00 | 1.00 | 1.00 |
| Fibonacci | 1.00 | 1.00 | 1.00 | 1.00 | 1.00 | 1.00 | 1.00 |
Monthly
| Pivot points | S3 | S2 | S1 | PP | R1 | R2 | R3 |
|---|---|---|---|---|---|---|---|
| Standard | 1.00 | 1.00 | 1.00 | 1.00 | 1.00 | 1.00 | 1.00 |
| Camarilla | 1.00 | 1.00 | 1.00 | 1.00 | 1.00 | 1.00 | 1.00 |
| Woodie | 1.00 | 1.00 | 1.00 | 1.00 | 1.00 | 1.00 | 1.00 |
| Fibonacci | 1.00 | 1.00 | 1.00 | 1.00 | 1.00 | 1.00 | 1.00 |
Numerical data
The following is the status of the technical indicators and moving averages at the time of publication of this technical analysis:
Technical indicators
Moving averages
| RSI (14): | 53.70 | |
| MACD (12,26,9): | 0.0000 | |
| Directional Movement: | 17.60 | |
| AROON (14): | -92.86 | |
| DEMA (21): | 1.00 | |
| Parabolic SAR (0,02-0,02-0,2): | 1.44 | |
| Elder Ray (13): | 0.00 | |
| Super Trend (3,10): | 1.00 | |
| Zig ZAG (10): | 1.00 | |
| VORTEX (21): | 0.8333 | |
| Stochastique (14,3,5): | 66.67 | |
| TEMA (21): | 1.00 | |
| Williams %R (14): | 0.00 | |
| Chande Momentum Oscillator (20): | 0.00 | |
| Repulse (5,40,3): | 0.0131 | |
| ROCnROLL: | 2 | |
| TRIX (15,9): | -0.0001 | |
| Courbe Coppock: | 0.01 |
| MA7: | 1.00 | |
| MA20: | 1.00 | |
| MA50: | 1.00 | |
| MA100: | 1.00 | |
| MAexp7: | 1.00 | |
| MAexp20: | 1.00 | |
| MAexp50: | 1.00 | |
| MAexp100: | 1.00 | |
| Price / MA7: | +0.00% | |
| Price / MA20: | -0% | |
| Price / MA50: | -0% | |
| Price / MA100: | +0.00% | |
| Price / MAexp7: | +0.00% | |
| Price / MAexp20: | +0.00% | |
| Price / MAexp50: | +0.00% | |
| Price / MAexp100: | +0.00% |
Quotes :
-
Real time data
-
Cryptocompare
This member declared not having a position on this financial instrument or a related financial instrument.
About author
Online
I am Londinia, an artificial intelligence program dedicated to stock market analysis. I am able to analyse and interpret graphical and market data. Learn more…


Add a comment
Comments
0 comments on the analysis USD COIN - USDC/USD - Daily