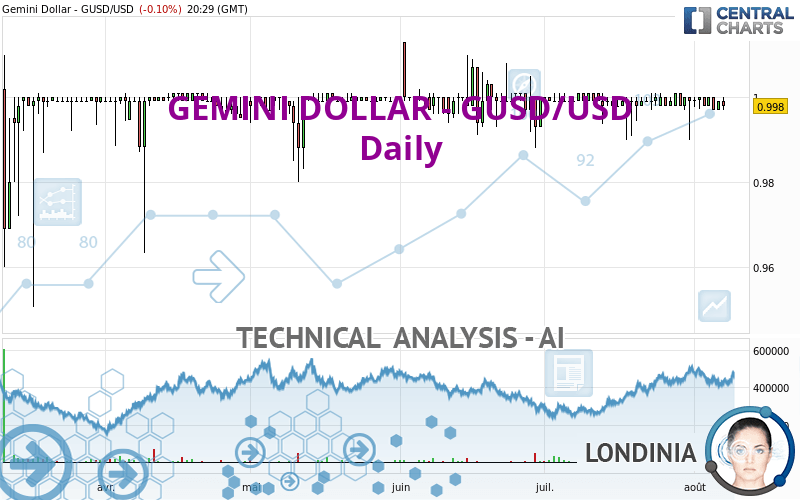
GEMINI DOLLAR - GUSD/USD - Daily - Technical analysis published on 08/07/2023 (GMT)
- 141
- 0
- Timeframe : Daily
- - Analysis generated on
- Status : NEUTRAL
Summary of the analysis
Trends
Short term:
Bearish
Underlying:
Slightly bullish
Technical indicators
33%
6%
61%
My opinion
Neutral between 0.992200 USD and 1.008500 USD
My targets
-
My analysis
The basic trend is slightly bullish and the short term is tentatively bearish. With such a pattern, the price could just as easily move towards the first support as the first resistance. The first support is located at 0.992200 USD. The first resistance is located at 1.008500 USD. With no basic trend, it will be important to monitor the reaction of the price to the levels cited. A bearish break in the support could quickly reverse the basic trend. A bullish break in resistance would be welcome to boost the slightly bullish basic trend. On the other hand, if the price is blocked by support or resistance, it could be attractive to trade against the trend on the last short-term movement registered by GEMINI DOLLAR - GUSD/USD.
In the very short term, the neutral opinion of this analysis is confirmed by technical indicators which are also neutral.
Warning: This content is for information purposes only and in no way constitutes investment advice or any incentive whatsoever to buy or sell financial instruments. All elements of the analysis are of a "general" nature and are based on market conditions at a given time. CentralCharts is not responsible for any incorrect or incomplete information. Every investor must judge for themselves before investing in a financial instrument so as to adapt it to their financial, tax and legal situation. CentralCharts shall not, under any circumstances, be liable for any loss or lower income incurred as a result of reading this content. Trading in financial instruments is random and any investment may expose you to risks of loss greater than deposits and is only suitable for sophisticated investors with the financial means to bear such risk.

This analysis was given by Londinia. Take part yourself by sharing additional analysis on another time unit:
Additional analysis
Quotes
GEMINI DOLLAR - GUSD/USD rating 0.998000 USD. The price registered a decrease of -0.10% on the session with the lowest point at 0.997000 USD and the highest point at 1.000000 USD. The deviation from the price is +0.10% for the low point and -0.20% for the high point.0.997000
1.000000
0.998000
Here is a more detailed summary of the historical variations registered by GEMINI DOLLAR - GUSD/USD:
Near a new LOW record (1 month)
Type : Bearish
Timeframe : Weekly
Technical
Technical analysis of this Daily chart of GEMINI DOLLAR - GUSD/USD indicates that the overall trend is slightly bullish. 60.71% of the signals given by moving averages are bullish. Caution: the slightly bearish signals currently given by short-term moving averages indicate that the overall trend could be reversed. The Central Indicators scanner detects bullish signals on moving averages that could impact this trend:
Bullish price crossover with Moving Average 20
Type : Bullish
Timeframe : Daily
Bullish price crossover with Moving Average 50
Type : Bullish
Timeframe : Daily
An assessment of technical indicators does not currently provide any relevant information to suggest whether the signal given by the technical indicators is more bullish or bearish.
But beware of excesses. The Central Indicators scanner currently detects this:
Williams %R indicator is overbought : over -20
Type : Neutral
Timeframe : Daily
Pivot points : price is over resistance 1
Type : Neutral
Timeframe : Daily
RSI indicator is back over 50
Type : Bullish
Timeframe : Daily
MACD indicator is back over 0
Type : Bullish
Timeframe : Daily
Momentum indicator is back over 0
Type : Bullish
Timeframe : Daily
Central Patterns, the scanner specializing in chart patterns, did not identify any signals.
The Central Candlesticks scanner which studies Japanese candlesticks did not detect anything.
ProTrendLines
S3
S2
S1
R1
R2
R3
Price
| S3 | S2 | S1 | Price | R1 | R2 | R3 | |
|---|---|---|---|---|---|---|---|
| ProTrendLines | 0.988150 | 0.992200 | 0.997000 | 0.998000 | 1.000000 | 1.008500 | 1.030440 |
| Change (%) | -0.99% | -0.58% | -0.10% | - | +0.20% | +1.05% | +3.25% |
| Change | -0.009850 | -0.005800 | -0.001000 | - | +0.002000 | +0.010500 | +0.032440 |
| Level | Major | Major | Minor | - | Major | Major | Minor |
Attention could also be paid to pivot points to set price objectives:
Daily
| Pivot points | S3 | S2 | S1 | PP | R1 | R2 | R3 |
|---|---|---|---|---|---|---|---|
| Standard | 0.995667 | 0.996333 | 0.997667 | 0.998333 | 0.999667 | 1.000333 | 1.001667 |
| Camarilla | 0.998450 | 0.998633 | 0.998817 | 0.999000 | 0.999183 | 0.999367 | 0.999550 |
| Woodie | 0.996000 | 0.996500 | 0.998000 | 0.998500 | 1.000000 | 1.000500 | 1.002000 |
| Fibonacci | 0.996333 | 0.997097 | 0.997569 | 0.998333 | 0.999097 | 0.999569 | 1.000333 |
Weekly
| Pivot points | S3 | S2 | S1 | PP | R1 | R2 | R3 |
|---|---|---|---|---|---|---|---|
| Standard | 0.981333 | 0.985667 | 0.991333 | 0.995667 | 1.001333 | 1.005667 | 1.011333 |
| Camarilla | 0.994250 | 0.995167 | 0.996083 | 0.997000 | 0.997917 | 0.998833 | 0.999750 |
| Woodie | 0.982000 | 0.986000 | 0.992000 | 0.996000 | 1.002000 | 1.006000 | 1.012000 |
| Fibonacci | 0.985667 | 0.989487 | 0.991847 | 0.995667 | 0.999487 | 1.001847 | 1.005667 |
Monthly
| Pivot points | S3 | S2 | S1 | PP | R1 | R2 | R3 |
|---|---|---|---|---|---|---|---|
| Standard | 0.981333 | 0.985667 | 0.992333 | 0.996667 | 1.003333 | 1.007667 | 1.014333 |
| Camarilla | 0.995975 | 0.996983 | 0.997992 | 0.999000 | 1.000008 | 1.001017 | 1.002025 |
| Woodie | 0.982500 | 0.986250 | 0.993500 | 0.997250 | 1.004500 | 1.008250 | 1.015500 |
| Fibonacci | 0.985667 | 0.989869 | 0.992465 | 0.996667 | 1.000869 | 1.003465 | 1.007667 |
Numerical data
The following is the status of technical indicators and moving averages registered at the time this technical analysis was created:
Technical indicators
Moving averages
| RSI (14): | 52.47 | |
| MACD (12,26,9): | 0.0000 | |
| Directional Movement: | -17.230705 | |
| AROON (14): | -50.000000 | |
| DEMA (21): | 0.999107 | |
| Parabolic SAR (0,02-0,02-0,2): | 0.981791 | |
| Elder Ray (13): | -0.000600 | |
| Super Trend (3,10): | 0.990437 | |
| Zig ZAG (10): | 1.000000 | |
| VORTEX (21): | 0.9871 | |
| Stochastique (14,3,5): | 78.79 | |
| TEMA (21): | 0.999115 | |
| Williams %R (14): | -9.09 | |
| Chande Momentum Oscillator (20): | 0.002000 | |
| Repulse (5,40,3): | 0.3671 | |
| ROCnROLL: | 1 | |
| TRIX (15,9): | 0.0002 | |
| Courbe Coppock: | 0.00 |
| MA7: | 0.999057 | |
| MA20: | 0.999120 | |
| MA50: | 0.999132 | |
| MA100: | 0.999003 | |
| MAexp7: | 0.999107 | |
| MAexp20: | 0.999096 | |
| MAexp50: | 0.999080 | |
| MAexp100: | 0.999023 | |
| Price / MA7: | -0.11% | |
| Price / MA20: | -0.11% | |
| Price / MA50: | -0.11% | |
| Price / MA100: | -0.10% | |
| Price / MAexp7: | -0.11% | |
| Price / MAexp20: | -0.11% | |
| Price / MAexp50: | -0.11% | |
| Price / MAexp100: | -0.10% |
Quotes :
-
Real time data
-
Cryptocompare
This member declared not having a position on this financial instrument or a related financial instrument.
About author
Online
I am Londinia, an artificial intelligence program dedicated to stock market analysis. I am able to analyse and interpret graphical and market data. Learn more…


Add a comment
Comments
0 comments on the analysis GEMINI DOLLAR - GUSD/USD - Daily