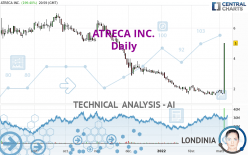
ATRECA INC. - Daily - Technical analysis published on 03/04/2022 (GMT)
- 156
- 0
Click here for a new analysis!
- Timeframe : Daily
- - Analysis generated on
- Status : TARGET REACHED

Summary of the analysis
Additional analysis
Quotes
The ATRECA INC. rating is 5.00 USD. The price has increased by +199.40% since the last closing and was between 1.67 USD and 5.01 USD. This implies that the price is at +199.40% from its lowest and at -0.20% from its highest.The Central Gaps scanner detects a bullish opening. A small advantage for buyers in the very short term.
Bullish opening
Type : Bullish
Timeframe : Openning
So that you have an overall view of the price change, here is a table showing the variations over several periods:
New HIGH record (1 month)
Type : Bullish
Timeframe : Weekly
The Central Volumes scanner detects abnormal volumes on the asset:
Abnormal volumes
Timeframe : 5 days
Abnormal volumes
Timeframe : 20 days
Technical
Technical analysis of this Daily chart of ATRECA INC. indicates that the overall trend is bearish. The signals given by moving averages are at 64.29% bearish. This bearish trend could slow down given the slightly bullish signals currently being given by short-term moving averages. The Central Indicators scanner detects bullish signals on moving averages that could impact this trend:
Bullish price crossover with Moving Average 20
Type : Bullish
Timeframe : Daily
Bullish price crossover with Moving Average 50
Type : Bullish
Timeframe : Daily
Bullish price crossover with adaptative moving average 20
Type : Bullish
Timeframe : Daily
Bullish price crossover with adaptative moving average 50
Type : Bullish
Timeframe : Daily
Bullish price crossover with adaptative moving average 100
Type : Bullish
Timeframe : Daily
The technical indicators are generally neutral. They do not provide relevant information on the direction of future price movements.
Caution: the Central Indicators scanner currently detects an excess:
CCI indicator is overbought : over 100
Type : Neutral
Timeframe : Daily
Williams %R indicator is overbought : over -20
Type : Neutral
Timeframe : Daily
Pivot points : price is over resistance 3
Type : Neutral
Timeframe : Daily
Pivot points : price is over resistance 3
Type : Neutral
Timeframe : Weekly
RSI indicator is back over 50
Type : Bullish
Timeframe : Daily
SuperTrend indicator bullish reversal
Type : Bullish
Timeframe : Daily
No signals are given by Central Patterns, a market scanner specialised in chart patterns, resistances and supports.
For a small rebound in the very short term, the Central Candlesticks scanner currently notes the presence of these bullish patterns in Japanese candlesticks:
White morning star
Type : Bullish
Timeframe : Daily
Long white line
Type : Bullish
Timeframe : Daily
| S2 | S1 | Price | R1 | R2 | R3 | |
|---|---|---|---|---|---|---|
| ProTrendLines | 1.65 | 4.94 | 5.00 | 6.32 | 7.82 | 10.38 |
| Change (%) | -67.00% | -1.20% | - | +26.40% | +56.40% | +107.60% |
| Change | -3.35 | -0.06 | - | +1.32 | +2.82 | +5.38 |
| Level | Major | Minor | - | Intermediate | Minor | Minor |
Attention could also be paid to pivot points to set price objectives:
| Pivot points | S3 | S2 | S1 | PP | R1 | R2 | R3 |
|---|---|---|---|---|---|---|---|
| Standard | -0.86 | 0.40 | 2.83 | 4.09 | 6.52 | 7.78 | 10.21 |
| Camarilla | 4.24 | 4.57 | 4.91 | 5.25 | 5.59 | 5.93 | 6.27 |
| Woodie | -0.29 | 0.69 | 3.41 | 4.38 | 7.10 | 8.07 | 10.79 |
| Fibonacci | 0.40 | 1.81 | 2.68 | 4.09 | 5.50 | 6.37 | 7.78 |
| Pivot points | S3 | S2 | S1 | PP | R1 | R2 | R3 |
|---|---|---|---|---|---|---|---|
| Standard | -0.93 | 0.35 | 2.80 | 4.08 | 6.53 | 7.81 | 10.26 |
| Camarilla | 4.22 | 4.57 | 4.91 | 5.25 | 5.59 | 5.93 | 6.28 |
| Woodie | -0.35 | 0.64 | 3.39 | 4.37 | 7.12 | 8.10 | 10.85 |
| Fibonacci | 0.35 | 1.78 | 2.66 | 4.08 | 5.51 | 6.39 | 7.81 |
| Pivot points | S3 | S2 | S1 | PP | R1 | R2 | R3 |
|---|---|---|---|---|---|---|---|
| Standard | 0.84 | 1.20 | 1.50 | 1.86 | 2.16 | 2.52 | 2.82 |
| Camarilla | 1.62 | 1.68 | 1.74 | 1.80 | 1.86 | 1.92 | 1.98 |
| Woodie | 0.81 | 1.19 | 1.47 | 1.85 | 2.13 | 2.51 | 2.79 |
| Fibonacci | 1.20 | 1.45 | 1.61 | 1.86 | 2.11 | 2.27 | 2.52 |
Numerical data
The following is the status of the technical indicators and moving averages at the time of publication of this technical analysis:
| RSI (14): | 40.77 | |
| MACD (12,26,9): | -0.1300 | |
| Directional Movement: | -7.89 | |
| AROON (14): | 35.71 | |
| DEMA (21): | 1.60 | |
| Parabolic SAR (0,02-0,02-0,2): | 1.57 | |
| Elder Ray (13): | -0.09 | |
| Super Trend (3,10): | 2.13 | |
| Zig ZAG (10): | 1.67 | |
| VORTEX (21): | 0.8600 | |
| Stochastique (14,3,5): | 52.37 | |
| TEMA (21): | 1.73 | |
| Williams %R (14): | -70.27 | |
| Chande Momentum Oscillator (20): | 0.05 | |
| Repulse (5,40,3): | -7.9400 | |
| ROCnROLL: | 2 | |
| TRIX (15,9): | -1.1700 | |
| Courbe Coppock: | 8.22 |
| MA7: | 1.74 | |
| MA20: | 1.76 | |
| MA50: | 2.19 | |
| MA100: | 3.48 | |
| MAexp7: | 1.74 | |
| MAexp20: | 1.81 | |
| MAexp50: | 2.31 | |
| MAexp100: | 3.41 | |
| Price / MA7: | +187.36% | |
| Price / MA20: | +184.09% | |
| Price / MA50: | +128.31% | |
| Price / MA100: | +43.68% | |
| Price / MAexp7: | +187.36% | |
| Price / MAexp20: | +176.24% | |
| Price / MAexp50: | +116.45% | |
| Price / MAexp100: | +46.63% |
News
The latest news and videos published on ATRECA INC. at the time of the analysis were as follows:
- Atreca to Participate in Cowen 42nd Annual Healthcare Conference
- Atreca Reports Fourth Quarter and Full-Year 2021 Financial Results and ATRC-101 Data Update
- Atreca to Report Fourth Quarter 2021 Results and Host Year-End Conference Call on March 3, 2022
- Atreca to Present Anti-SARS-CoV-2 Antibody Discoveries at Keystone Symposia Conference: Antibodies as Drugs
- Atreca to Present at Upcoming Virtual Investor Conferences
About author

Online


Add a comment
Comments
0 comments on the analysis ATRECA INC. - Daily