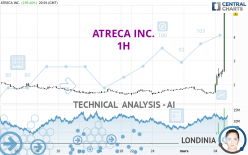
ATRECA INC. - 1H - Technical analysis published on 03/07/2022 (GMT)
- 116
- 0
Click here for a new analysis!
- Timeframe : 1H
- - Analysis generated on
- Status : INVALID

Summary of the analysis
Additional analysis
Quotes
ATRECA INC. rating 5.00 USD. The price has increased by +199.40% since the last closing with the lowest point at 1.67 USD and the highest point at 5.01 USD. The deviation from the price is +199.40% for the low point and -0.20% for the high point.A bullish opening was detected by the Central Gaps scanner. Buyers are trying to impose a bullish momentum in the very short term.
Bullish opening
Type : Bullish
Timeframe : Openning
So that you have an overall view of the price change, here is a table showing the variations over several periods:
New HIGH record (1st january)
Type : Bullish
Timeframe : Weekly
New HIGH record (1 month)
Type : Bullish
Timeframe : Weekly
The Central Volumes scanner notes the presence of abnormal volumes:
Abnormal volumes
Timeframe : 5 days
Abnormal volumes
Timeframe : 20 days
Abnormal volumes
Timeframe : 50 days
Technical
Technical analysis of this 1H chart of ATRECA INC. indicates that the overall trend is strongly bullish. 92.86% of the signals given by moving averages are bullish. This strongly bullish trend is supported by the strong bullish signals given by short-term moving averages. The Central Indicators scanner does not detect any result on moving averages that would impact this trend.
Technical indicators are strongly bullish, suggesting that the price increase should continue.
Caution: the Central Indicators scanner currently detects an excess:
RSI indicator is overbought : over 90
Type : Neutral
Timeframe : 1 hour
CCI indicator is overbought : over 100
Type : Neutral
Timeframe : 1 hour
Williams %R indicator is overbought : over -20
Type : Neutral
Timeframe : 1 hour
Pivot points : price is over resistance 3
Type : Neutral
Timeframe : 1 hour
Pivot points : price is over resistance 3
Type : Neutral
Timeframe : Weekly
Central Patterns, the scanner specializing in chart patterns, did not identify any signals.
The presence of a bullish Japanese candlestick pattern detected by Central Candlesticks that could cause a very short term rebound was also detected:
Long white line
Type : Bullish
Timeframe : 1 hour
| S3 | S2 | S1 | Price | R1 | R2 | R3 | |
|---|---|---|---|---|---|---|---|
| ProTrendLines | 2.22 | 2.69 | 4.94 | 5.00 | 6.32 | 7.82 | 10.38 |
| Change (%) | -55.60% | -46.20% | -1.20% | - | +26.40% | +56.40% | +107.60% |
| Change | -2.78 | -2.31 | -0.06 | - | +1.32 | +2.82 | +5.38 |
| Level | Minor | Minor | Minor | - | Intermediate | Minor | Minor |
To determine price objectives, it is also possible to use the pivot points. Here is the price position in relation to pivot points:
| Pivot points | S3 | S2 | S1 | PP | R1 | R2 | R3 |
|---|---|---|---|---|---|---|---|
| Standard | -0.90 | 0.39 | 2.79 | 4.08 | 6.48 | 7.77 | 10.17 |
| Camarilla | 4.19 | 4.52 | 4.86 | 5.20 | 5.54 | 5.88 | 6.22 |
| Woodie | -0.34 | 0.67 | 3.36 | 4.36 | 7.05 | 8.05 | 10.74 |
| Fibonacci | 0.39 | 1.80 | 2.67 | 4.08 | 5.49 | 6.36 | 7.77 |
| Pivot points | S3 | S2 | S1 | PP | R1 | R2 | R3 |
|---|---|---|---|---|---|---|---|
| Standard | -0.96 | 0.33 | 2.77 | 4.06 | 6.50 | 7.79 | 10.23 |
| Camarilla | 4.17 | 4.52 | 4.86 | 5.20 | 5.54 | 5.88 | 6.23 |
| Woodie | -0.40 | 0.62 | 3.34 | 4.35 | 7.07 | 8.08 | 10.80 |
| Fibonacci | 0.33 | 1.76 | 2.64 | 4.06 | 5.49 | 6.37 | 7.79 |
| Pivot points | S3 | S2 | S1 | PP | R1 | R2 | R3 |
|---|---|---|---|---|---|---|---|
| Standard | 0.84 | 1.20 | 1.50 | 1.86 | 2.16 | 2.52 | 2.82 |
| Camarilla | 1.62 | 1.68 | 1.74 | 1.80 | 1.86 | 1.92 | 1.98 |
| Woodie | 0.81 | 1.19 | 1.47 | 1.85 | 2.13 | 2.51 | 2.79 |
| Fibonacci | 1.20 | 1.45 | 1.61 | 1.86 | 2.11 | 2.27 | 2.52 |
Numerical data
The following are the details of the technical indicators and moving averages that were collected to generate this technical analysis:
| RSI (14): | 95.72 | |
| MACD (12,26,9): | 0.4100 | |
| Directional Movement: | 75.67 | |
| AROON (14): | 85.71 | |
| DEMA (21): | 2.77 | |
| Parabolic SAR (0,02-0,02-0,2): | 1.89 | |
| Elder Ray (13): | 1.35 | |
| Super Trend (3,10): | 2.64 | |
| Zig ZAG (10): | 5.25 | |
| VORTEX (21): | 1.1200 | |
| Stochastique (14,3,5): | 91.16 | |
| TEMA (21): | 3.14 | |
| Williams %R (14): | -2.95 | |
| Chande Momentum Oscillator (20): | 3.62 | |
| Repulse (5,40,3): | 77.8500 | |
| ROCnROLL: | 1 | |
| TRIX (15,9): | 1.0500 | |
| Courbe Coppock: | 130.93 |
| MA7: | 2.25 | |
| MA20: | 1.91 | |
| MA50: | 2.22 | |
| MA100: | 3.47 | |
| MAexp7: | 3.06 | |
| MAexp20: | 2.34 | |
| MAexp50: | 2.02 | |
| MAexp100: | 1.91 | |
| Price / MA7: | +122.22% | |
| Price / MA20: | +161.78% | |
| Price / MA50: | +125.23% | |
| Price / MA100: | +44.09% | |
| Price / MAexp7: | +71.57% | |
| Price / MAexp20: | +124.36% | |
| Price / MAexp50: | +159.90% | |
| Price / MAexp100: | +174.87% |
News
The latest news and videos published on ATRECA INC. at the time of the analysis were as follows:
- Atreca to Participate in Cowen 42nd Annual Healthcare Conference
- Atreca Reports Fourth Quarter and Full-Year 2021 Financial Results and ATRC-101 Data Update
- Atreca to Report Fourth Quarter 2021 Results and Host Year-End Conference Call on March 3, 2022
- Atreca to Present Anti-SARS-CoV-2 Antibody Discoveries at Keystone Symposia Conference: Antibodies as Drugs
- Atreca to Present at Upcoming Virtual Investor Conferences
About author

Online


Add a comment
Comments
0 comments on the analysis ATRECA INC. - 1H