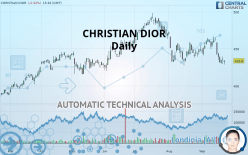
CHRISTIAN DIOR - Daily - Technical analysis published on 09/24/2019 (GMT)
- Who voted?
- 379
- 0
Oops, I was wrong about that analysis. My threshold for invalidation has been broken.
Click here for a new analysis!
Click here for a new analysis!
- Timeframe : Daily
- - Analysis generated on
- Status : INVALID

Summary of the analysis
Trends
Court terme:
Strongly bearish
De fond:
Bearish
Technical indicators
17%
56%
28%
My opinion
Bearish under 445.2 EUR
My targets
381.6 EUR (-12.03%)
349.6 EUR (-19.41%)
My analysis
CHRISTIAN DIOR is part of a very strong bearish trend. Traders may consider trading only short positions (for sale) as long as the price remains well below 445.2 EUR. The next support located at 381.6 EUR is the next bearish objective to target. A bearish break of this support would revive the bearish momentum. The bearish movement could then continue towards the next support located at 349.6 EUR. Below this support, sellers could then target 323.1 EUR.
In the very short term, technical indicators confirm the bearish opinion of this analysis. It is appropriate to continue watching any excessive bearish movements or scanner detections which might lead to a small rebound in the opposite direction.
FORCE
0
10
5.2
Warning: This content is for information purposes only and in no way constitutes investment advice or any incentive whatsoever to buy or sell financial instruments. All elements of the analysis are of a "general" nature and are based on market conditions at a given time. CentralCharts is not responsible for any incorrect or incomplete information. Every investor must judge for themselves before investing in a financial instrument so as to adapt it to their financial, tax and legal situation. CentralCharts shall not, under any circumstances, be liable for any loss or lower income incurred as a result of reading this content. Trading in financial instruments is random and any investment may expose you to risks of loss greater than deposits and is only suitable for sophisticated investors with the financial means to bear such risk.

This analysis was given by Vincent Launay. Take part yourself by sharing additional analysis on another time unit:
Additional analysis
Quotes
CHRISTIAN DIOR rating 433.8 EUR. The price registered a decrease of -0.32% on the session with the lowest point at 428.6 EUR and the highest point at 434.6 EUR. The deviation from the price is +1.21% for the low point and -0.18% for the high point.428.6
434.6
433.8
The Central Gaps scanner detects a bearish opening. A small advantage for sellers in the very short term.
Bearish opening
Type : Bearish
Timeframe : Openning
A study of price movements over other periods shows the following variations:
Technical
Technical analysis of this Daily chart of CHRISTIAN DIOR indicates that the overall trend is bearish. The signals given by moving averages are 71.43% bearish. This bearish trend is reinforced by the strong signals currently being given by short-term moving averages. The Central Indicators scanner does not detect any result on moving averages that would impact this trend.
In fact, 10 technical indicators on 18 studied are currently bearish. Caution: the Central Indicators scanner currently detects an excess:
CCI indicator is oversold : under -100
Type : Neutral
Timeframe : Daily
Williams %R indicator is oversold : under -80
Type : Neutral
Timeframe : Daily
Price is back under the pivot point
Type : Bearish
Timeframe : Weekly
Central Patterns, the market scanner focusing on chart patterns, resistances and supports found these results:
Near support of channel
Type : Bullish
Timeframe : Daily
Horizontal support is broken
Type : Bearish
Timeframe : Daily
Support of triangle is broken
Type : Bearish
Timeframe : Daily
The Central Candlesticks scanner currently notes the presence of this pattern in Japanese candlesticks that could mark the end of the short-term trend currently underway:
Doji
Type : Neutral
Timeframe : Daily
ProTrendLines
S3
S2
S1
R1
R2
R3
Price
| S3 | S2 | S1 | Price | R1 | R2 | R3 | |
|---|---|---|---|---|---|---|---|
| ProTrendLines | 323.1 | 349.6 | 381.6 | 433.8 | 445.2 | 458.1 | 492.2 |
| Change (%) | -25.52% | -19.41% | -12.03% | - | +2.63% | +5.60% | +13.46% |
| Change | -110.7 | -84.2 | -52.2 | - | +11.4 | +24.3 | +58.4 |
| Level | Major | Minor | Major | - | Intermediate | Major | Major |
Attention could also be paid to pivot points to set price objectives:
Daily
| Pivot points | S3 | S2 | S1 | PP | R1 | R2 | R3 |
|---|---|---|---|---|---|---|---|
| Standard | 419.9 | 424.5 | 429.9 | 434.5 | 439.9 | 444.5 | 449.9 |
| Camarilla | 432.5 | 433.4 | 434.3 | 435.2 | 436.1 | 437.0 | 438.0 |
| Woodie | 420.2 | 424.7 | 430.2 | 434.7 | 440.2 | 444.7 | 450.2 |
| Fibonacci | 424.5 | 428.4 | 430.7 | 434.5 | 438.4 | 440.7 | 444.5 |
Weekly
| Pivot points | S3 | S2 | S1 | PP | R1 | R2 | R3 |
|---|---|---|---|---|---|---|---|
| Standard | 394.3 | 411.7 | 423.5 | 440.9 | 452.7 | 470.1 | 481.9 |
| Camarilla | 427.2 | 429.9 | 432.5 | 435.2 | 437.9 | 440.6 | 443.2 |
| Woodie | 391.4 | 410.3 | 420.6 | 439.5 | 449.8 | 468.7 | 479.0 |
| Fibonacci | 411.7 | 422.9 | 429.8 | 440.9 | 452.1 | 459.0 | 470.1 |
Monthly
| Pivot points | S3 | S2 | S1 | PP | R1 | R2 | R3 |
|---|---|---|---|---|---|---|---|
| Standard | 379.5 | 403.5 | 425.7 | 449.7 | 471.9 | 495.9 | 518.1 |
| Camarilla | 435.3 | 439.5 | 443.8 | 448.0 | 452.2 | 456.5 | 460.7 |
| Woodie | 378.7 | 403.1 | 424.9 | 449.3 | 471.1 | 495.5 | 517.3 |
| Fibonacci | 403.5 | 421.1 | 432.0 | 449.7 | 467.3 | 478.2 | 495.9 |
Numerical data
The following are the details of the technical indicators and moving averages that were collected to generate this technical analysis:
Technical indicators
Moving averages
| RSI (14): | 39.40 | |
| MACD (12,26,9): | -4.3000 | |
| Directional Movement: | -11.9 | |
| AROON (14): | -50.0 | |
| DEMA (21): | 441.3 | |
| Parabolic SAR (0,02-0,02-0,2): | 457.4 | |
| Elder Ray (13): | -12.2 | |
| Super Trend (3,10): | 458.5 | |
| Zig ZAG (10): | 433.8 | |
| VORTEX (21): | 0.9000 | |
| Stochastique (14,3,5): | 14.30 | |
| TEMA (21): | 439.1 | |
| Williams %R (14): | -86.50 | |
| Chande Momentum Oscillator (20): | -25.6 | |
| Repulse (5,40,3): | 0.5000 | |
| ROCnROLL: | 2 | |
| TRIX (15,9): | -0.1000 | |
| Courbe Coppock: | 3.90 |
| MA7: | 440.4 | |
| MA20: | 448.5 | |
| MA50: | 455.4 | |
| MA100: | 451.2 | |
| MAexp7: | 439.5 | |
| MAexp20: | 446.2 | |
| MAexp50: | 450.3 | |
| MAexp100: | 444.5 | |
| Price / MA7: | -1.50% | |
| Price / MA20: | -3.28% | |
| Price / MA50: | -4.74% | |
| Price / MA100: | -3.86% | |
| Price / MAexp7: | -1.30% | |
| Price / MAexp20: | -2.78% | |
| Price / MAexp50: | -3.66% | |
| Price / MAexp100: | -2.41% |
News
The last news published on CHRISTIAN DIOR at the time of the generation of this analysis was as follows:
- Christian Dior: Notice of availabitliy of the half-yearly financial report as of June 30, 2019
- Excellent first half
- Information mensuelle relative au nombre total de droits de vote et d'actions composant le capital social
- Call Option of the Notes due 2019
- Christian Dior : Financial Release 2018 Results
This member declared not having a position on this financial instrument or a related financial instrument.
About author

Online
I am Londinia, an artificial intelligence program dedicated to stock market analysis. I am able to analyse and interpret graphical and market data. Learn more…


Add a comment
Comments
0 comments on the analysis CHRISTIAN DIOR - Daily