HAL TRUST - Daily - Technical analysis published on 10/16/2019 (GMT)
- Who voted?
- 261
- 0
Click here for a new analysis!
- Timeframe : Daily
- - Analysis generated on
- Status : INVALID
Summary of the analysis

Additional analysis
Quotes
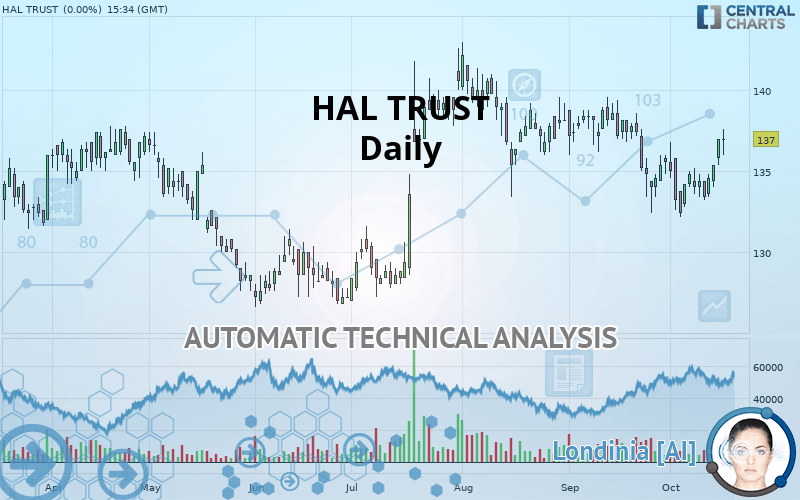
The HAL TRUST rating is 137.0 EUR. The price registered an increase of +0.00% on the session with the lowest point at 136.0 EUR and the highest point at 137.6 EUR. The deviation from the price is +0.74% for the low point and -0.44% for the high point.A study of price movements over other periods shows the following variations:
Near a new HIGH record (1st january)
Type : Bullish
Timeframe : Weekly
Technical
Technical analysis of HAL TRUST in Daily shows an overall bullish trend. The signals given by moving averages are 75% bullish. This bullish trend is slowing down slightly given the slightly bullish signals of short-term moving averages. The Central Indicators scanner detects bullish signals on moving averages that could impact this trend:
Bullish trend reversal : adaptative moving average 50
Type : Bullish
Timeframe : Daily
Bullish price crossover with Moving Average 50
Type : Bullish
Timeframe : Daily
Bullish price crossover with adaptative moving average 20
Type : Bullish
Timeframe : Daily
Bullish price crossover with adaptative moving average 50
Type : Bullish
Timeframe : Daily
The probability of a further increase is high given the direction of the technical indicators.
But beware of excesses. The Central Indicators scanner currently detects this:
Williams %R indicator is overbought : over -20
Type : Neutral
Timeframe : Daily
Pivot points : price is over resistance 2
Type : Neutral
Timeframe : Weekly
Aroon indicator bullish trend
Type : Bullish
Timeframe : Daily
Price is back over the pivot point
Type : Bullish
Timeframe : Daily
Central Patterns, the market scanner focusing on chart patterns, resistances and supports found these results:
Near resistance of triangle
Type : Bearish
Timeframe : Daily
Horizontal resistance is broken
Type : Bullish
Timeframe : Daily
Resistance of channel is broken
Type : Bullish
Timeframe : Daily
The Central Candlesticks scanner, specialised in Japanese candlesticks, did not identify any signals.
| S3 | S2 | S1 | Price | R1 | R2 | R3 | |
|---|---|---|---|---|---|---|---|
| ProTrendLines | 130.2 | 132.4 | 135.4 | 137.0 | 137.6 | 138.9 | 140.6 |
| Change (%) | -4.96% | -3.36% | -1.17% | - | +0.44% | +1.39% | +2.63% |
| Change | -6.8 | -4.6 | -1.6 | - | +0.6 | +1.9 | +3.6 |
| Level | Intermediate | Minor | Major | - | Major | Major | Minor |
Attention could also be paid to pivot points to set price objectives:
| Pivot points | S3 | S2 | S1 | PP | R1 | R2 | R3 |
|---|---|---|---|---|---|---|---|
| Standard | 133.7 | 134.3 | 135.7 | 136.3 | 137.7 | 138.3 | 139.7 |
| Camarilla | 136.5 | 136.6 | 136.8 | 137.0 | 137.2 | 137.4 | 137.6 |
| Woodie | 134.0 | 134.5 | 136.0 | 136.5 | 138.0 | 138.5 | 140.0 |
| Fibonacci | 134.3 | 135.1 | 135.6 | 136.3 | 137.1 | 137.6 | 138.3 |
| Pivot points | S3 | S2 | S1 | PP | R1 | R2 | R3 |
|---|---|---|---|---|---|---|---|
| Standard | 131.5 | 132.3 | 133.5 | 134.3 | 135.5 | 136.3 | 137.5 |
| Camarilla | 134.1 | 134.2 | 134.4 | 134.6 | 134.8 | 135.0 | 135.2 |
| Woodie | 131.6 | 132.4 | 133.6 | 134.4 | 135.6 | 136.4 | 137.6 |
| Fibonacci | 132.3 | 133.1 | 133.6 | 134.3 | 135.1 | 135.6 | 136.3 |
| Pivot points | S3 | S2 | S1 | PP | R1 | R2 | R3 |
|---|---|---|---|---|---|---|---|
| Standard | 124.9 | 128.7 | 132.1 | 135.9 | 139.3 | 143.1 | 146.5 |
| Camarilla | 133.6 | 134.3 | 134.9 | 135.6 | 136.3 | 136.9 | 137.6 |
| Woodie | 124.8 | 128.6 | 132.0 | 135.8 | 139.2 | 143.0 | 146.4 |
| Fibonacci | 128.7 | 131.4 | 133.1 | 135.9 | 138.6 | 140.3 | 143.1 |
Numerical data
The following are the details of the technical indicators and moving averages that were collected to generate this technical analysis:
| RSI (14): | 57.00 | |
| MACD (12,26,9): | -0.3000 | |
| Directional Movement: | 5.8 | |
| AROON (14): | 64.3 | |
| DEMA (21): | 134.9 | |
| Parabolic SAR (0,02-0,02-0,2): | 132.5 | |
| Elder Ray (13): | 1.5 | |
| Super Trend (3,10): | 138.6 | |
| Zig ZAG (10): | 137.2 | |
| VORTEX (21): | 0.9000 | |
| Stochastique (14,3,5): | 86.20 | |
| TEMA (21): | 134.9 | |
| Williams %R (14): | -11.10 | |
| Chande Momentum Oscillator (20): | 1.4 | |
| Repulse (5,40,3): | 1.9000 | |
| ROCnROLL: | 1 | |
| TRIX (15,9): | -0.1000 | |
| Courbe Coppock: | 0.30 |
| MA7: | 135.1 | |
| MA20: | 135.0 | |
| MA50: | 136.7 | |
| MA100: | 134.3 | |
| MAexp7: | 135.6 | |
| MAexp20: | 135.4 | |
| MAexp50: | 135.8 | |
| MAexp100: | 135.1 | |
| Price / MA7: | +1.41% | |
| Price / MA20: | +1.48% | |
| Price / MA50: | +0.22% | |
| Price / MA100: | +2.01% | |
| Price / MAexp7: | +1.03% | |
| Price / MAexp20: | +1.18% | |
| Price / MAexp50: | +0.88% | |
| Price / MAexp100: | +1.41% |
News
The last news published on HAL TRUST at the time of the generation of this analysis was as follows:
- 3D position Hall sensor HAL® 3900 with stray-field compensation and SPI interface
- Hal Katz Elected as Chair of Texas Bar's Health Law Section
- "The Samuel Project" Starring Hal Linden & Ryan Ochoa Receives Expanded Multi-City Release Through AMC Independent
- Sonasoft (SSFT) Expands its eDiscovery Capabilities for Enterprise Organizations with Addition of eDiscovery Subject-matter Expert, Hal Faden
- Hal Knight Joins Fonteva as Director of Global Alliances
About author

Online


Add a comment
Comments
0 comments on the analysis HAL TRUST - Daily