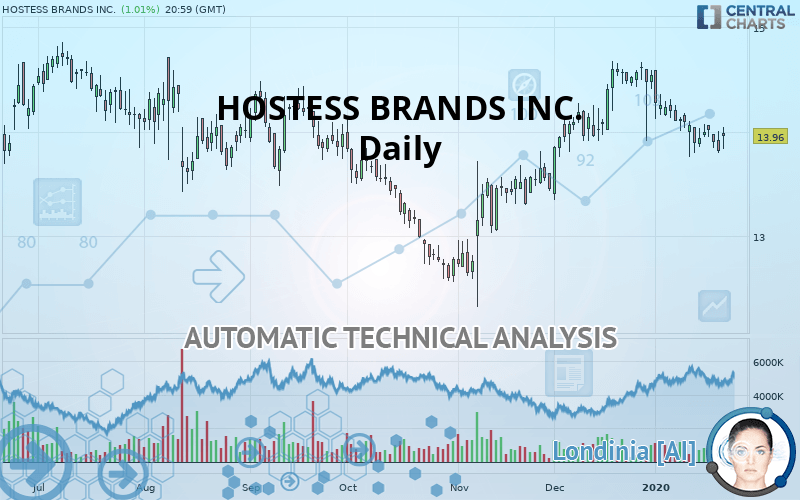
HOSTESS BRANDS INC. - Daily - Technical analysis published on 01/23/2020 (GMT)
- Who voted?
- 248
- 0
Click here for a new analysis!
- Timeframe : Daily
- - Analysis generated on
- Status : TARGET REACHED
Summary of the analysis
Additional analysis
Quotes
HOSTESS BRANDS INC. rating 13.96 USD. On the day, this instrument lost +1.01% and was between 13.83 USD and 14.05 USD. This implies that the price is at +0.94% from its lowest and at -0.64% from its highest.A bullish opening was detected by the Central Gaps scanner. Buyers are trying to impose a bullish momentum in the very short term.
Bullish opening
Type : Bullish
Timeframe : Openning
So that you have an overall view of the price change, here is a table showing the variations over several periods:
Technical
Technical analysis of HOSTESS BRANDS INC. in Daily shows a neutral overall trend. The trend could quickly turn bearish due to the strong bearish signals currently being given by short-term moving averages. The Central Indicators scanner detects bearish signals on moving averages that could impact this trend:
Bearish trend reversal : Moving Average 100
Type : Bearish
Timeframe : Daily
Bearish price crossover with adaptative moving average 50
Type : Bearish
Timeframe : Daily
Bearish price crossover with adaptative moving average 100
Type : Bearish
Timeframe : Daily
The probability of a further decline is low given the direction of the technical indicators.
Caution: the Central Indicators scanner currently detects an excess:
CCI indicator is oversold : under -100
Type : Neutral
Timeframe : Daily
CCI indicator: bullish divergence
Type : Bullish
Timeframe : Daily
Williams %R indicator is oversold : under -80
Type : Neutral
Timeframe : Daily
Pivot points : price is over resistance 1
Type : Neutral
Timeframe : Daily
Price is back under the pivot point
Type : Bearish
Timeframe : Daily
Central Patterns, the market scanner focusing on chart patterns, resistances and supports found this result:
Near horizontal resistance
Type : Bearish
Timeframe : Daily
No result was found by the Central Candlesticks scanner on Japanese candlesticks.
| S3 | S2 | S1 | Price | R1 | R2 | R3 | |
|---|---|---|---|---|---|---|---|
| ProTrendLines | 12.91 | 13.10 | 13.61 | 13.96 | 14.03 | 14.24 | 14.43 |
| Change (%) | -7.52% | -6.16% | -2.51% | - | +0.50% | +2.01% | +3.37% |
| Change | -1.05 | -0.86 | -0.35 | - | +0.07 | +0.28 | +0.47 |
| Level | Minor | Minor | Intermediate | - | Intermediate | Intermediate | Intermediate |
Attention could also be paid to pivot points to set price objectives:
| Pivot points | S3 | S2 | S1 | PP | R1 | R2 | R3 |
|---|---|---|---|---|---|---|---|
| Standard | 13.53 | 13.67 | 13.74 | 13.88 | 13.95 | 14.09 | 14.16 |
| Camarilla | 13.76 | 13.78 | 13.80 | 13.82 | 13.84 | 13.86 | 13.88 |
| Woodie | 13.51 | 13.65 | 13.72 | 13.86 | 13.93 | 14.07 | 14.14 |
| Fibonacci | 13.67 | 13.75 | 13.80 | 13.88 | 13.96 | 14.01 | 14.09 |
| Pivot points | S3 | S2 | S1 | PP | R1 | R2 | R3 |
|---|---|---|---|---|---|---|---|
| Standard | 13.49 | 13.63 | 13.82 | 13.96 | 14.16 | 14.30 | 14.50 |
| Camarilla | 13.93 | 13.96 | 13.99 | 14.02 | 14.05 | 14.08 | 14.11 |
| Woodie | 13.52 | 13.64 | 13.85 | 13.98 | 14.19 | 14.31 | 14.52 |
| Fibonacci | 13.63 | 13.75 | 13.83 | 13.96 | 14.09 | 14.17 | 14.30 |
| Pivot points | S3 | S2 | S1 | PP | R1 | R2 | R3 |
|---|---|---|---|---|---|---|---|
| Standard | 12.37 | 12.86 | 13.70 | 14.19 | 15.03 | 15.52 | 16.36 |
| Camarilla | 14.17 | 14.30 | 14.42 | 14.54 | 14.66 | 14.78 | 14.91 |
| Woodie | 12.55 | 12.95 | 13.88 | 14.28 | 15.21 | 15.61 | 16.54 |
| Fibonacci | 12.86 | 13.37 | 13.68 | 14.19 | 14.70 | 15.01 | 15.52 |
Numerical data
The following are the details of the technical indicators and moving averages that were collected to generate this technical analysis:
| RSI (14): | 45.44 | |
| MACD (12,26,9): | -0.0500 | |
| Directional Movement: | -12.77 | |
| AROON (14): | -50.00 | |
| DEMA (21): | 14.04 | |
| Parabolic SAR (0,02-0,02-0,2): | 14.36 | |
| Elder Ray (13): | -0.09 | |
| Super Trend (3,10): | 14.53 | |
| Zig ZAG (10): | 13.96 | |
| VORTEX (21): | 0.8400 | |
| Stochastique (14,3,5): | 18.73 | |
| TEMA (21): | 13.89 | |
| Williams %R (14): | -67.09 | |
| Chande Momentum Oscillator (20): | -0.28 | |
| Repulse (5,40,3): | -1.0400 | |
| ROCnROLL: | -1 | |
| TRIX (15,9): | 0.0100 | |
| Courbe Coppock: | 6.62 |
| MA7: | 13.93 | |
| MA20: | 14.18 | |
| MA50: | 13.98 | |
| MA100: | 13.77 | |
| MAexp7: | 13.96 | |
| MAexp20: | 14.07 | |
| MAexp50: | 13.98 | |
| MAexp100: | 13.84 | |
| Price / MA7: | +0.22% | |
| Price / MA20: | -1.55% | |
| Price / MA50: | -0.14% | |
| Price / MA100: | +1.38% | |
| Price / MAexp7: | -0% | |
| Price / MAexp20: | -0.78% | |
| Price / MAexp50: | -0.14% | |
| Price / MAexp100: | +0.87% |
News
The last news published on HOSTESS BRANDS INC. at the time of the generation of this analysis was as follows:
- Hostess Brands, Inc. to Report Fourth Quarter and Full Year 2018 Financial Results on February 27, 2019
- Market Trends Toward New Normal in Altria Group, WesBanco, NVR, Investors Real Estate Trust, Kaman, and Hostess Brands — Emerging Consolidated Expectations, Analyst Ratings
- Hostess Brands, Inc. Class A to Host Earnings Call
- Investor Network: Hostess Brands, Inc. to Host Earnings Call
- Investor Network: Hostess Brands, Inc. to Host Earnings Call
About author

Online


Add a comment
Comments
0 comments on the analysis HOSTESS BRANDS INC. - Daily