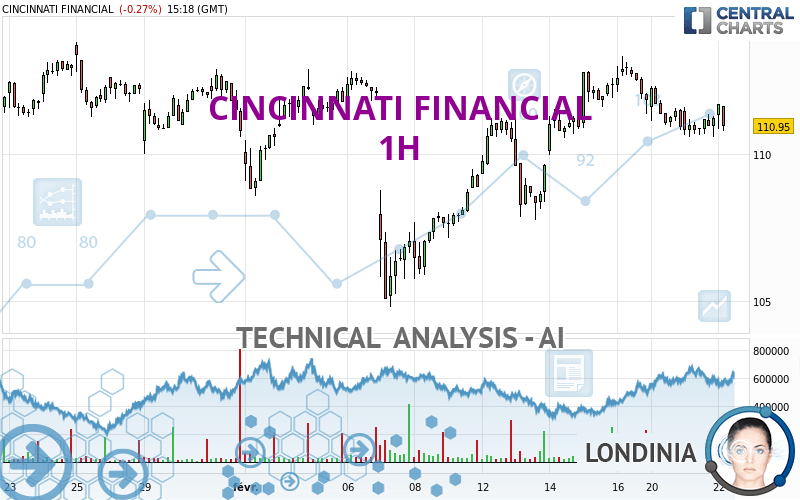
CINCINNATI FINANCIAL - 1H - Technical analysis published on 02/22/2024 (GMT)
- 91
- 0
Click here for a new analysis!
- Timeframe : 1H
- - Analysis generated on
- Status : TARGET REACHED
Summary of the analysis

Additional analysis
Quotes
CINCINNATI FINANCIAL rating 111.17 USD. The price registered a decrease of -0.07% on the session and was between 110.87 USD and 111.72 USD. This implies that the price is at +0.27% from its lowest and at -0.49% from its highest.The Central Gaps scanner detects a bullish opening. A small advantage for buyers in the very short term.
Bullish opening
Type : Bullish
Timeframe : Openning
Here is a more detailed summary of the historical variations registered by CINCINNATI FINANCIAL:
Near a new HIGH record (1st january)
Type : Bullish
Timeframe : Weekly
Near a new HIGH record (1 month)
Type : Bullish
Timeframe : Weekly
Technical
Technical analysis of CINCINNATI FINANCIAL in 1H shows an overall bullish trend. 75.00% of the signals given by moving averages are bullish. Caution: the neutral signals currently given by the short-term moving averages indicate that this bullish trend is showing signs of running out of steam. The Central Indicators scanner detects bullish and bearish signals on moving averages that could impact this trend:
Bullish trend reversal : Moving Average 100
Type : Bullish
Timeframe : 1 hour
Bearish price crossover with Moving Average 20
Type : Bearish
Timeframe : 1 hour
Bearish price crossover with adaptative moving average 20
Type : Bearish
Timeframe : 1 hour
On the 18 technical indicators analysed, 5 are bullish, 6 are neutral and 7 are bearish. But beware of excesses. The Central Indicators scanner currently detects this:
RSI indicator: bearish divergence
Type : Bearish
Timeframe : 1 hour
RSI indicator is back under 50
Type : Bearish
Timeframe : 1 hour
Momentum indicator is back under 0
Type : Bearish
Timeframe : 1 hour
Williams %R indicator is back under -50
Type : Bearish
Timeframe : 1 hour
Central Patterns, the scanner specializing in chart patterns, did not identify any signals.
Central Candlesticks, the scanner specialised in Japanese candlesticks, detects this inversion signal that could impact the current short-term trend:
Doji
Type : Neutral
Timeframe : 1 hour
| S3 | S2 | S1 | Price | R1 | R2 | R3 | |
|---|---|---|---|---|---|---|---|
| ProTrendLines | 106.40 | 108.56 | 110.01 | 111.17 | 111.26 | 111.95 | 112.95 |
| Change (%) | -4.29% | -2.35% | -1.04% | - | +0.08% | +0.70% | +1.60% |
| Change | -4.77 | -2.61 | -1.16 | - | +0.09 | +0.78 | +1.78 |
| Level | Minor | Major | Minor | - | Intermediate | Minor | Major |
To determine price objectives, it is also possible to use the pivot points. Here is the price position in relation to pivot points:
| Pivot points | S3 | S2 | S1 | PP | R1 | R2 | R3 |
|---|---|---|---|---|---|---|---|
| Standard | 109.65 | 110.12 | 110.68 | 111.15 | 111.71 | 112.18 | 112.74 |
| Camarilla | 110.97 | 111.06 | 111.16 | 111.25 | 111.34 | 111.44 | 111.53 |
| Woodie | 109.71 | 110.14 | 110.74 | 111.17 | 111.77 | 112.20 | 112.80 |
| Fibonacci | 110.12 | 110.51 | 110.75 | 111.15 | 111.54 | 111.78 | 112.18 |
| Pivot points | S3 | S2 | S1 | PP | R1 | R2 | R3 |
|---|---|---|---|---|---|---|---|
| Standard | 103.02 | 105.39 | 108.62 | 110.99 | 114.22 | 116.59 | 119.82 |
| Camarilla | 110.32 | 110.83 | 111.35 | 111.86 | 112.37 | 112.89 | 113.40 |
| Woodie | 103.46 | 105.61 | 109.06 | 111.21 | 114.66 | 116.81 | 120.26 |
| Fibonacci | 105.39 | 107.53 | 108.85 | 110.99 | 113.13 | 114.45 | 116.59 |
| Pivot points | S3 | S2 | S1 | PP | R1 | R2 | R3 |
|---|---|---|---|---|---|---|---|
| Standard | 94.19 | 98.73 | 104.76 | 109.30 | 115.33 | 119.87 | 125.90 |
| Camarilla | 107.89 | 108.86 | 109.83 | 110.80 | 111.77 | 112.74 | 113.71 |
| Woodie | 94.95 | 99.10 | 105.52 | 109.67 | 116.09 | 120.24 | 126.66 |
| Fibonacci | 98.73 | 102.76 | 105.26 | 109.30 | 113.33 | 115.83 | 119.87 |
Numerical data
The following are the details of the technical indicators and moving averages that were collected to generate this technical analysis:
| RSI (14): | 50.87 | |
| MACD (12,26,9): | -0.0200 | |
| Directional Movement: | -0.42 | |
| AROON (14): | -50.00 | |
| DEMA (21): | 111.36 | |
| Parabolic SAR (0,02-0,02-0,2): | 110.60 | |
| Elder Ray (13): | 0.16 | |
| Super Trend (3,10): | 110.77 | |
| Zig ZAG (10): | 111.28 | |
| VORTEX (21): | 0.8700 | |
| Stochastique (14,3,5): | 50.95 | |
| TEMA (21): | 111.04 | |
| Williams %R (14): | -72.27 | |
| Chande Momentum Oscillator (20): | -0.12 | |
| Repulse (5,40,3): | -0.1500 | |
| ROCnROLL: | 2 | |
| TRIX (15,9): | 0.0000 | |
| Courbe Coppock: | 1.48 |
| MA7: | 111.14 | |
| MA20: | 110.92 | |
| MA50: | 107.81 | |
| MA100: | 104.07 | |
| MAexp7: | 111.19 | |
| MAexp20: | 111.35 | |
| MAexp50: | 111.08 | |
| MAexp100: | 110.68 | |
| Price / MA7: | +0.03% | |
| Price / MA20: | +0.23% | |
| Price / MA50: | +3.12% | |
| Price / MA100: | +6.82% | |
| Price / MAexp7: | -0.02% | |
| Price / MAexp20: | -0.16% | |
| Price / MAexp50: | +0.08% | |
| Price / MAexp100: | +0.44% |
News
The latest news and videos published on CINCINNATI FINANCIAL at the time of the analysis were as follows:
- Cincinnati Financial Reports Fourth-Quarter and Full-Year 2023 Results
- Cincinnati Financial Corporation Announces Executive Leadership Transition, Expands Board to 14, Appoints Two New Directors
- Cincinnati Financial Corporation Increases Regular Quarterly Cash Dividend
- Cincinnati Financial Schedules Webcast to Discuss Fourth-Quarter and Full-Year 2023 Results
- Cincinnati Financial Corporation Declares Regular Quarterly Cash Dividend
About author
Online


Add a comment
Comments
0 comments on the analysis CINCINNATI FINANCIAL - 1H