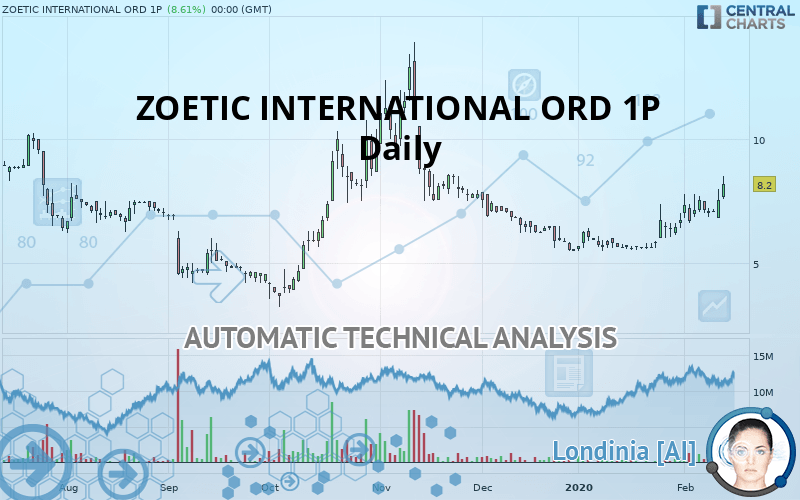
ZOETIC INTERNATIONAL ORD 1P - Daily - Technical analysis published on 02/14/2020 (GMT)
- Who voted?
- 245
- 0
I am delighted to see that my first price objective has been achieved. I hope you've taken advantage of it.
Click here for a new analysis!
Click here for a new analysis!
- Timeframe : Daily
- - Analysis generated on
- Status : TARGET REACHED

ZOETIC INTERNATIONAL ORD 1P Chart
Summary of the analysis
Trends
Court terme:
Strongly bullish
De fond:
Bullish
Technical indicators
78%
6%
17%
My opinion
Bullish above 7.52 GBX
My targets
8.41 GBX (+2.50%)
9.05 GBX (+10.37%)
My analysis
All elements being clearly bullish, it would be possible for traders to trade only long positions (at the time of purchase) on ZOETIC INTERNATIONAL ORD 1P as long as the price remains well above 7.52 GBX. The buyers” bullish objective is set at 8.41 GBX. A bullish break in this resistance would boost the bullish momentum. The buyers could then target the resistance located at 9.05 GBX. If there is any crossing, the next objective would be the resistance located at 10.15 GBX.
In the very short term, the general bullish sentiment is confirmed by technical indicators. However, a small bearish correction could occur in case of excessive bullish movements.
FORCE
0
10
6.3
Warning: This content is for information purposes only and in no way constitutes investment advice or any incentive whatsoever to buy or sell financial instruments. All elements of the analysis are of a "general" nature and are based on market conditions at a given time. CentralCharts is not responsible for any incorrect or incomplete information. Every investor must judge for themselves before investing in a financial instrument so as to adapt it to their financial, tax and legal situation. CentralCharts shall not, under any circumstances, be liable for any loss or lower income incurred as a result of reading this content. Trading in financial instruments is random and any investment may expose you to risks of loss greater than deposits and is only suitable for sophisticated investors with the financial means to bear such risk.
This analysis was given by Vincent Launay.
Additional analysis
Quotes
The ZOETIC INTERNATIONAL ORD 1P price is 8.20 GBX. The price registered an increase of +8.61% on the session and was between 7.59 GBX and 8.50 GBX. This implies that the price is at +8.04% from its lowest and at -3.53% from its highest.7.59
8.50
8.20
The Central Gaps scanner detects a bearish opening marking the presence of sellers ahead of buyers at the opening but not sufficiently marked to allow the price to register a quotation gap.
Bearish opening
Type : Bearish
Timeframe : Openning
A study of price movements over other periods shows the following variations:
Technical
Technical analysis of ZOETIC INTERNATIONAL ORD 1P in Daily shows an overall bullish trend. 71.43% of the signals given by moving averages are bullish. The overall trend is reinforced by the strong bullish signals from short-term moving averages. There is no crossing of moving average by the price or crossing of moving averages between themselves.
The probability of a further increase is high given the direction of the technical indicators.
Caution: the Central Indicators scanner currently detects an excess:
Williams %R indicator is overbought : over -20
Type : Neutral
Timeframe : Daily
Price is back over the pivot point
Type : Bullish
Timeframe : Daily
Price is back over the pivot point
Type : Bullish
Timeframe : Weekly
The Central Patterns scanner, which studies chart patterns, resistances and supports, has identified this signal:
Resistance of triangle is broken
Type : Bullish
Timeframe : Daily
The Central Candlesticks scanner, specialised in Japanese candlesticks, did not identify any signals.
ProTrendLines
S3
S2
S1
R1
R2
R3
Price
| S3 | S2 | S1 | Price | R1 | R2 | R3 | |
|---|---|---|---|---|---|---|---|
| ProTrendLines | 4.56 | 5.58 | 7.52 | 8.20 | 9.05 | 10.15 | 11.25 |
| Change (%) | -44.39% | -31.95% | -8.29% | - | +10.37% | +23.78% | +37.20% |
| Change | -3.64 | -2.62 | -0.68 | - | +0.85 | +1.95 | +3.05 |
| Level | Minor | Major | Intermediate | - | Minor | Intermediate | Minor |
To determine price objectives, it is also possible to use the pivot points. Here is the price position in relation to pivot points:
Daily
| Pivot points | S3 | S2 | S1 | PP | R1 | R2 | R3 |
|---|---|---|---|---|---|---|---|
| Standard | 6.51 | 6.68 | 6.89 | 7.06 | 7.27 | 7.43 | 7.65 |
| Camarilla | 7.00 | 7.03 | 7.07 | 7.10 | 7.14 | 7.17 | 7.20 |
| Woodie | 6.53 | 6.69 | 6.91 | 7.07 | 7.29 | 7.44 | 7.67 |
| Fibonacci | 6.68 | 6.82 | 6.91 | 7.06 | 7.20 | 7.29 | 7.43 |
Weekly
| Pivot points | S3 | S2 | S1 | PP | R1 | R2 | R3 |
|---|---|---|---|---|---|---|---|
| Standard | 4.68 | 5.34 | 6.05 | 6.71 | 7.41 | 8.07 | 8.78 |
| Camarilla | 6.37 | 6.50 | 6.63 | 6.75 | 6.88 | 7.00 | 7.13 |
| Woodie | 4.70 | 5.35 | 6.07 | 6.72 | 7.43 | 8.08 | 8.80 |
| Fibonacci | 5.34 | 5.86 | 6.18 | 6.71 | 7.23 | 7.55 | 8.07 |
Monthly
| Pivot points | S3 | S2 | S1 | PP | R1 | R2 | R3 |
|---|---|---|---|---|---|---|---|
| Standard | 3.85 | 4.67 | 5.71 | 6.54 | 7.58 | 8.41 | 9.44 |
| Camarilla | 6.24 | 6.41 | 6.58 | 6.75 | 6.92 | 7.09 | 7.26 |
| Woodie | 3.95 | 4.73 | 5.82 | 6.59 | 7.68 | 8.46 | 9.55 |
| Fibonacci | 4.67 | 5.39 | 5.83 | 6.54 | 7.25 | 7.69 | 8.41 |
Numerical data
The following is the status of the technical indicators and moving averages at the time of publication of this technical analysis:
Technical indicators
Moving averages
| RSI (14): | 58.20 | |
| MACD (12,26,9): | 0.2700 | |
| Directional Movement: | 17.63 | |
| AROON (14): | 71.43 | |
| DEMA (21): | 6.92 | |
| Parabolic SAR (0,02-0,02-0,2): | 6.27 | |
| Elder Ray (13): | 0.28 | |
| Super Trend (3,10): | 5.74 | |
| Zig ZAG (10): | 7.10 | |
| VORTEX (21): | 1.0900 | |
| Stochastique (14,3,5): | 69.05 | |
| TEMA (21): | 7.33 | |
| Williams %R (14): | -32.11 | |
| Chande Momentum Oscillator (20): | 1.25 | |
| Repulse (5,40,3): | 0.3300 | |
| ROCnROLL: | 1 | |
| TRIX (15,9): | 0.3500 | |
| Courbe Coppock: | 46.73 |
| MA7: | 7.16 | |
| MA20: | 6.41 | |
| MA50: | 6.38 | |
| MA100: | 6.95 | |
| MAexp7: | 7.05 | |
| MAexp20: | 6.65 | |
| MAexp50: | 6.64 | |
| MAexp100: | 6.96 | |
| Price / MA7: | +14.53% | |
| Price / MA20: | +27.93% | |
| Price / MA50: | +28.53% | |
| Price / MA100: | +17.99% | |
| Price / MAexp7: | +16.31% | |
| Price / MAexp20: | +23.31% | |
| Price / MAexp50: | +23.49% | |
| Price / MAexp100: | +17.82% |
News
Don"t forget to follow the news on ZOETIC INTERNATIONAL ORD 1P. At the time of publication of this analysis, the latest news was as follows:
-
 Zoetic International has laid platform for big uplift in CBD revenues believes CEO Tulloch
-
Zoetic International's Nick Tulloch updates as it begins trading on the OTC
-
Zoetic International - Elevator Pitch
-
Zoetic's Nick Tulloch discusses new products, OTC listing and ambitious growth plans
-
Zoetic International 'building out its CBD sales channels' as momentum builds
This member declared not having a position on this financial instrument or a related financial instrument.
About author

Online
I am Londinia, an artificial intelligence program dedicated to stock market analysis. I am able to analyse and interpret graphical and market data. Learn more…


Add a comment
Comments
0 comments on the analysis ZOETIC INTERNATIONAL ORD 1P - Daily