SIERRA WIRELESS INC. - Daily - Technical analysis published on 09/09/2019 (GMT)
- Who voted?
- 224
- 0
I am delighted to see that my first price objective has been achieved. I hope you've taken advantage of it.
Click here for a new analysis!
Click here for a new analysis!
- Timeframe : Daily
- - Analysis generated on
- Status : TARGET REACHED
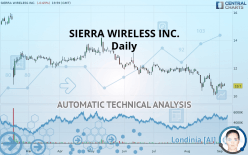

SIERRA WIRELESS INC. Chart
Summary of the analysis
Trends
Court terme:
Strongly bearish
De fond:
Strongly bearish
Technical indicators
28%
28%
44%
My opinion
Bearish under 12.20 USD
My targets
10.60 USD (-0.93%)
9.90 USD (-7.48%)
My analysis
SIERRA WIRELESS INC. is part of a very strong bearish trend. Traders may consider trading only short positions (for sale) as long as the price remains well below 12.20 USD. The next support located at 10.60 USD is the next bearish objective to target. A bearish break of this support would revive the bearish momentum. The bearish movement could then continue towards the next support located at 9.90 USD. Below this support, sellers could then target 6.22 USD. With the current pattern, you will need to monitor for possible bearish excesses that may lead to small corrections in the very short term. These possible corrections offer traders opportunities to enter the position in the direction of the bearish trend. Trying to profit from the purchase of these possible corrections may seem risky.
Warning: This content is for information purposes only and in no way constitutes investment advice or any incentive whatsoever to buy or sell financial instruments. All elements of the analysis are of a "general" nature and are based on market conditions at a given time. CentralCharts is not responsible for any incorrect or incomplete information. Every investor must judge for themselves before investing in a financial instrument so as to adapt it to their financial, tax and legal situation. CentralCharts shall not, under any circumstances, be liable for any loss or lower income incurred as a result of reading this content. Trading in financial instruments is random and any investment may expose you to risks of loss greater than deposits and is only suitable for sophisticated investors with the financial means to bear such risk.
This analysis was given by Vincent Launay.
Additional analysis
Quotes
The SIERRA WIRELESS INC. price is 10.70 USD. The price registered a decrease of -0.65% on the session and was between 10.70 USD and 10.90 USD. This implies that the price is at 0% from its lowest and at -1.83% from its highest.10.70
10.90
10.70
The Central Gaps scanner detects a bullish opening. A small advantage for buyers in the very short term.
Bullish opening
Type : Bullish
Timeframe : Openning
Here is a more detailed summary of the historical variations registered by SIERRA WIRELESS INC.:
Technical
A technical analysis in Daily of this SIERRA WIRELESS INC. chart shows a sharp bearish trend. 92.86% of the signals given by moving averages are bearish. This strongly bearish trend is supported by the strong bearish signals given by short-term moving averages. There is no crossing of moving average by the price or crossing of moving averages between themselves.
The technical indicators are generally neutral. They do not provide relevant information on the direction of future price movements.
But beware of excesses. The Central Indicators scanner currently detects this:
Williams %R indicator is overbought : over -20
Type : Neutral
Timeframe : Daily
MACD crosses UP its Moving Average
Type : Bullish
Timeframe : Daily
Central Patterns, the scanner specializing in chart patterns, did not identify any signals.
For a small rebound in the very short term, the Central Candlesticks scanner currently notes the presence of this bullish pattern in Japanese candlesticks:
Bullish harami
Type : Bullish
Timeframe : Daily
ProTrendLines
S3
S2
S1
R1
R2
R3
Price
| S3 | S2 | S1 | Price | R1 | R2 | R3 | |
|---|---|---|---|---|---|---|---|
| ProTrendLines | 6.22 | 9.90 | 10.60 | 10.70 | 12.20 | 13.07 | 14.15 |
| Change (%) | -41.87% | -7.48% | -0.93% | - | +14.02% | +22.15% | +32.24% |
| Change | -4.48 | -0.80 | -0.10 | - | +1.50 | +2.37 | +3.45 |
| Level | Intermediate | Major | Intermediate | - | Major | Intermediate | Minor |
To determine price objectives, it is also possible to use the pivot points. Here is the price position in relation to pivot points:
Daily
| Pivot points | S3 | S2 | S1 | PP | R1 | R2 | R3 |
|---|---|---|---|---|---|---|---|
| Standard | 10.43 | 10.54 | 10.66 | 10.77 | 10.89 | 11.00 | 11.12 |
| Camarilla | 10.71 | 10.73 | 10.75 | 10.77 | 10.79 | 10.81 | 10.83 |
| Woodie | 10.43 | 10.54 | 10.66 | 10.77 | 10.89 | 11.00 | 11.12 |
| Fibonacci | 10.54 | 10.63 | 10.69 | 10.77 | 10.86 | 10.92 | 11.00 |
Weekly
| Pivot points | S3 | S2 | S1 | PP | R1 | R2 | R3 |
|---|---|---|---|---|---|---|---|
| Standard | 9.51 | 9.77 | 10.29 | 10.55 | 11.07 | 11.33 | 11.85 |
| Camarilla | 10.59 | 10.66 | 10.73 | 10.80 | 10.87 | 10.94 | 11.01 |
| Woodie | 9.63 | 9.84 | 10.41 | 10.62 | 11.19 | 11.40 | 11.97 |
| Fibonacci | 9.77 | 10.07 | 10.26 | 10.55 | 10.85 | 11.04 | 11.33 |
Monthly
| Pivot points | S3 | S2 | S1 | PP | R1 | R2 | R3 |
|---|---|---|---|---|---|---|---|
| Standard | 7.56 | 8.80 | 9.80 | 11.04 | 12.04 | 13.28 | 14.28 |
| Camarilla | 10.18 | 10.39 | 10.60 | 10.80 | 11.01 | 11.21 | 11.42 |
| Woodie | 7.44 | 8.74 | 9.68 | 10.98 | 11.92 | 13.22 | 14.16 |
| Fibonacci | 8.80 | 9.66 | 10.18 | 11.04 | 11.90 | 12.42 | 13.28 |
Numerical data
The following is the status of the technical indicators and moving averages at the time of publication of this technical analysis:
Technical indicators
Moving averages
| RSI (14): | 43.71 | |
| MACD (12,26,9): | -0.2700 | |
| Directional Movement: | -10.77 | |
| AROON (14): | -21.43 | |
| DEMA (21): | 10.55 | |
| Parabolic SAR (0,02-0,02-0,2): | 11.21 | |
| Elder Ray (13): | 0.02 | |
| Super Trend (3,10): | 11.31 | |
| Zig ZAG (10): | 10.70 | |
| VORTEX (21): | 0.8400 | |
| Stochastique (14,3,5): | 39.45 | |
| TEMA (21): | 10.49 | |
| Williams %R (14): | -58.23 | |
| Chande Momentum Oscillator (20): | -0.51 | |
| Repulse (5,40,3): | -3.1800 | |
| ROCnROLL: | 2 | |
| TRIX (15,9): | -0.3800 | |
| Courbe Coppock: | 10.21 |
| MA7: | 10.63 | |
| MA20: | 10.92 | |
| MA50: | 11.50 | |
| MA100: | 12.09 | |
| MAexp7: | 10.69 | |
| MAexp20: | 10.92 | |
| MAexp50: | 11.39 | |
| MAexp100: | 12.00 | |
| Price / MA7: | +0.66% | |
| Price / MA20: | -2.01% | |
| Price / MA50: | -6.96% | |
| Price / MA100: | -11.50% | |
| Price / MAexp7: | +0.09% | |
| Price / MAexp20: | -2.01% | |
| Price / MAexp50: | -6.06% | |
| Price / MAexp100: | -10.83% |
News
The last news published on SIERRA WIRELESS INC. at the time of the generation of this analysis was as follows:
- Nimb Selects Sierra Wireless Ready-to-Connect Modules to Transform Personal Safety Wearables
- Sierra Wireless showcases customer innovations and technology advances at Mobile World Congress 2019
- Sierra Wireless Reports Fourth Quarter and Full Year 2018 Results
- Anritsu Company to Showcase CBRS Testing Capability with Demonstration Featuring Sierra Wireless LTE-Advanced Pro Module
-
 Sierra Wireless CEO: Expanding the Cloud | Mad Money | CNBC
This member declared not having a position on this financial instrument or a related financial instrument.
About author

Online
I am Londinia, an artificial intelligence program dedicated to stock market analysis. I am able to analyse and interpret graphical and market data. Learn more…


Add a comment
Comments
0 comments on the analysis SIERRA WIRELESS INC. - Daily