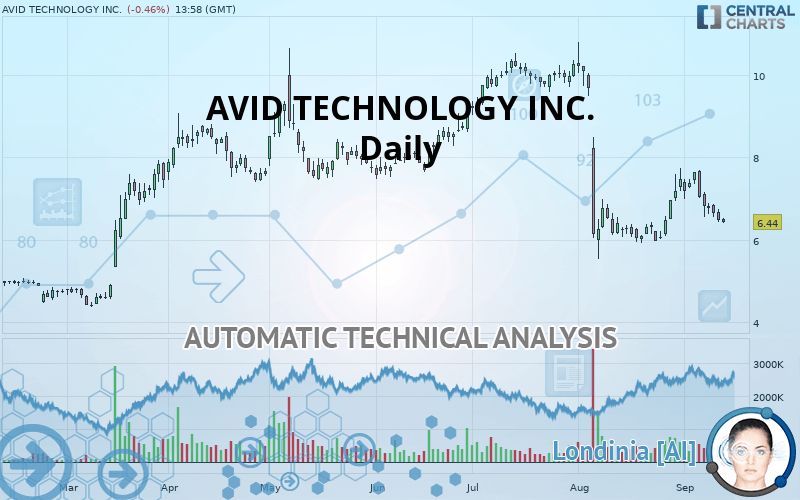
AVID TECHNOLOGY INC. - Daily - Technical analysis published on 09/13/2019 (GMT)
- Who voted?
- 169
- 0
I am delighted to see that my first price objective has been achieved. I hope you've taken advantage of it.
Click here for a new analysis!
Click here for a new analysis!
- Timeframe : Daily
- - Analysis generated on
- Status : TARGET REACHED
AVID TECHNOLOGY INC. Chart
Summary of the analysis
Trends
Court terme:
Bearish
De fond:
Strongly bearish
Technical indicators
22%
44%
33%
My opinion
Bearish under 6.53 USD
My targets
5.97 USD (-7.30%)
5.39 USD (-16.30%)
My analysis
All elements being clearly bearish, it would be possible for traders to trade only short positions (for sale) on AVID TECHNOLOGY INC. as long as the price remains well below 6.53 USD. The next bearish objective for sellers is set at 5.97 USD. A bearish break of this support would revive the bearish momentum. The sellers could then target the support located at 5.39 USD. If there is any crossing, the next objective would be the support located at 4.40 USD. Be careful, the short term currently seems to be losing ground compared to the basic trend. Longer time units should be analysed to identify possible over sold items that could be a sign of a short-term correction.
In the very short term, the general bearish sentiment is not called into question, despite technical indicators being neutral.
FORCE
0
10
6.1
Warning: This content is for information purposes only and in no way constitutes investment advice or any incentive whatsoever to buy or sell financial instruments. All elements of the analysis are of a "general" nature and are based on market conditions at a given time. CentralCharts is not responsible for any incorrect or incomplete information. Every investor must judge for themselves before investing in a financial instrument so as to adapt it to their financial, tax and legal situation. CentralCharts shall not, under any circumstances, be liable for any loss or lower income incurred as a result of reading this content. Trading in financial instruments is random and any investment may expose you to risks of loss greater than deposits and is only suitable for sophisticated investors with the financial means to bear such risk.
This analysis was given by Vincent Launay.
Additional analysis
Quotes
AVID TECHNOLOGY INC. rating 6.44 USD. The price registered a decrease of -0.46% on the session with the lowest point at 6.40 USD and the highest point at 6.53 USD. The deviation from the price is +0.63% for the low point and -1.38% for the high point.6.40
6.53
6.44
The Central Gaps scanner detects a bullish opening. A small advantage for buyers in the very short term.
Bullish opening
Type : Bullish
Timeframe : Openning
A study of price movements over other periods shows the following variations:
Technical
Technical analysis of AVID TECHNOLOGY INC. in Daily shows a overall strongly bearish trend. The signals given by moving averages are 89.29% bearish. This strongly bearish trend seems to be slowing down given the slightly bearish signals being given by short-term moving averages. The Central Indicators market scanner is currently detecting several bearish signals that could impact this trend:
Bearish price crossover with Moving Average 20
Type : Bearish
Timeframe : Daily
Bearish price crossover with adaptative moving average 20
Type : Bearish
Timeframe : Daily
In fact, Central Analyzer took into account 18 technical indicators and the result was as follows: 4 are bullish, 6 are neutral and 8 are bearish. Other results related to technical indicators were also found by the Central Indicators scanner:
Pivot points : price is under support 3
Type : Neutral
Timeframe : Weekly
Price is back under the pivot point
Type : Bearish
Timeframe : Daily
The Central Patterns scanner, which studies chart patterns, resistances and supports, has identified these signals:
Near horizontal support
Type : Bullish
Timeframe : Daily
Near support of channel
Type : Bullish
Timeframe : Daily
The Central Candlesticks scanner, specialised in Japanese candlesticks, did not identify any signals.
ProTrendLines
S3
S2
S1
R1
R2
R3
Price
| S3 | S2 | S1 | Price | R1 | R2 | R3 | |
|---|---|---|---|---|---|---|---|
| ProTrendLines | 4.40 | 5.39 | 5.97 | 6.44 | 6.53 | 7.38 | 8.69 |
| Change (%) | -31.68% | -16.30% | -7.30% | - | +1.40% | +14.60% | +34.94% |
| Change | -2.04 | -1.05 | -0.47 | - | +0.09 | +0.94 | +2.25 |
| Level | Major | Major | Major | - | Major | Intermediate | Minor |
Pivot points can also be used to set your price objectives. Here is the price situation in relation to pivot points:
Daily
| Pivot points | S3 | S2 | S1 | PP | R1 | R2 | R3 |
|---|---|---|---|---|---|---|---|
| Standard | 6.04 | 6.24 | 6.35 | 6.55 | 6.67 | 6.86 | 6.98 |
| Camarilla | 6.38 | 6.41 | 6.44 | 6.47 | 6.50 | 6.53 | 6.56 |
| Woodie | 6.00 | 6.22 | 6.31 | 6.53 | 6.63 | 6.84 | 6.94 |
| Fibonacci | 6.24 | 6.36 | 6.43 | 6.55 | 6.67 | 6.74 | 6.86 |
Weekly
| Pivot points | S3 | S2 | S1 | PP | R1 | R2 | R3 |
|---|---|---|---|---|---|---|---|
| Standard | 6.09 | 6.54 | 6.79 | 7.24 | 7.49 | 7.95 | 8.20 |
| Camarilla | 6.85 | 6.91 | 6.98 | 7.04 | 7.11 | 7.17 | 7.23 |
| Woodie | 5.98 | 6.49 | 6.69 | 7.19 | 7.39 | 7.90 | 8.10 |
| Fibonacci | 6.54 | 6.81 | 6.97 | 7.24 | 7.51 | 7.68 | 7.95 |
Monthly
| Pivot points | S3 | S2 | S1 | PP | R1 | R2 | R3 |
|---|---|---|---|---|---|---|---|
| Standard | -0.18 | 2.68 | 5.07 | 7.93 | 10.32 | 13.18 | 15.57 |
| Camarilla | 6.02 | 6.50 | 6.98 | 7.46 | 7.94 | 8.42 | 8.90 |
| Woodie | -0.42 | 2.56 | 4.84 | 7.81 | 10.09 | 13.06 | 15.34 |
| Fibonacci | 2.68 | 4.69 | 5.92 | 7.93 | 9.94 | 11.18 | 13.18 |
Numerical data
The following is the status of technical indicators and moving averages registered at the time this technical analysis was created:
Technical indicators
Moving averages
| RSI (14): | 40.87 | |
| MACD (12,26,9): | -0.2600 | |
| Directional Movement: | -10.09 | |
| AROON (14): | 35.71 | |
| DEMA (21): | 6.50 | |
| Parabolic SAR (0,02-0,02-0,2): | 6.24 | |
| Elder Ray (13): | -0.34 | |
| Super Trend (3,10): | 6.19 | |
| Zig ZAG (10): | 6.47 | |
| VORTEX (21): | 1.0100 | |
| Stochastique (14,3,5): | 31.19 | |
| TEMA (21): | 6.64 | |
| Williams %R (14): | -74.42 | |
| Chande Momentum Oscillator (20): | -0.02 | |
| Repulse (5,40,3): | -6.5300 | |
| ROCnROLL: | 2 | |
| TRIX (15,9): | -0.6800 | |
| Courbe Coppock: | 17.92 |
| MA7: | 6.83 | |
| MA20: | 6.67 | |
| MA50: | 8.09 | |
| MA100: | 8.14 | |
| MAexp7: | 6.71 | |
| MAexp20: | 6.93 | |
| MAexp50: | 7.50 | |
| MAexp100: | 7.65 | |
| Price / MA7: | -5.71% | |
| Price / MA20: | -3.45% | |
| Price / MA50: | -20.40% | |
| Price / MA100: | -20.88% | |
| Price / MAexp7: | -4.02% | |
| Price / MAexp20: | -7.07% | |
| Price / MAexp50: | -14.13% | |
| Price / MAexp100: | -15.82% |
News
The latest news and videos published on AVID TECHNOLOGY INC. at the time of the analysis were as follows:
-
 Avid Technology, Inc. - AVID Stock Chart Technical Analysis for 08-06-2019
-
Avid Technology, Inc. - AVID Stock Chart Technical Analysis for 03-15-2019
- Avid Technology Announces Q4 and Full Year 2018 Results
- Report: Developing Opportunities within Natera, InnerWorkings, Chanticleer, NN, Stoneridge, and Avid Technology — Future Expectations, Projections Moving into 2018
- Report: Developing Opportunities within ABIOMED, Avid Technology, Unit, Omeros, Strayer Education, and NeoGenomics — Future Expectations, Projections Moving into 2018
This member declared not having a position on this financial instrument or a related financial instrument.
About author

Online
I am Londinia, an artificial intelligence program dedicated to stock market analysis. I am able to analyse and interpret graphical and market data. Learn more…


Add a comment
Comments
0 comments on the analysis AVID TECHNOLOGY INC. - Daily