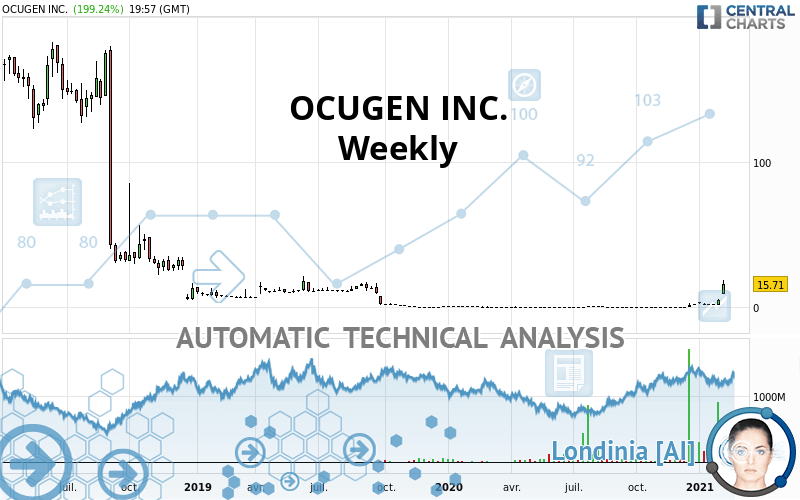
OCUGEN INC. - Weekly - Technical analysis published on 02/08/2021 (GMT)
- 246
- 0
Click here for a new analysis!
- Timeframe : Weekly
- - Analysis generated on
- Status : LEVEL MAINTAINED

Summary of the analysis

Additional analysis
Quotes
OCUGEN INC. rating 15.70 USD. The price registered an increase of +767.40% over 5 days with the lowest point at 3.11 USD and the highest point at 5.90 USD. The deviation from the price is +404.82% for the low point and +166.10% for the high point.The Central Gaps scanner detects a bullish gap which is a sign that buyers have taken the lead in the very short term.
Opening Gap UP
Type : Bullish
Timeframe : Openning
Here is a more detailed summary of the historical variations registered by OCUGEN INC.:
New HIGH record (1 year)
Type : Bullish
Timeframe : Weekly
New HIGH record (1st january)
Type : Bullish
Timeframe : Weekly
New HIGH record (1 month)
Type : Bullish
Timeframe : Weekly
The Central Volumes scanner detects abnormal volumes on the asset:
Abnormal volumes
Timeframe : 5 days
Abnormal volumes
Timeframe : 20 days
Abnormal volumes
Timeframe : 50 days
Technical
A technical analysis in Weekly of this OCUGEN INC. chart shows a bullish trend. The signals returned by the moving averages are 75.00% bullish. This bullish trend is reinforced by the strong signals currently being given by short-term moving averages. An assessment of moving averages reveals several bullish signals that could impact this trend:
Bullish trend reversal : adaptative moving average 50
Type : Bullish
Timeframe : Weekly
Bullish price crossover with Moving Average 100
Type : Bullish
Timeframe : Weekly
Technical indicators are strongly bullish, suggesting that the price increase should continue.
Caution: the Central Indicators scanner currently detects an excess:
CCI indicator is overbought : over 100
Type : Neutral
Timeframe : Weekly
Williams %R indicator is overbought : over -20
Type : Neutral
Timeframe : Weekly
Pivot points : price is over resistance 3
Type : Neutral
Timeframe : Weekly
Williams %R indicator is back over -50
Type : Bullish
Timeframe : Weekly
Central Patterns, the scanner specializing in chart patterns, did not identify any signals.
The presence of a bullish Japanese candlestick pattern detected by Central Candlesticks that could cause a very short term rebound was also detected:
Long white line
Type : Bullish
Timeframe : Weekly
| S1 | Price | R1 | R2 | R3 | |
|---|---|---|---|---|---|
| ProTrendLines | 0.40 | 15.70 | 18.60 | 102.40 | 139.80 |
| Change (%) | -97.45% | - | +18.47% | +552.23% | +790.45% |
| Change | -15.30 | - | +2.90 | +86.70 | +124.10 |
| Level | Major | - | Minor | Minor | Minor |
Attention could also be paid to pivot points to set price objectives:
| Pivot points | S3 | S2 | S1 | PP | R1 | R2 | R3 |
|---|---|---|---|---|---|---|---|
| Standard | 0.82 | 1.96 | 3.61 | 4.75 | 6.40 | 7.54 | 9.19 |
| Camarilla | 4.48 | 4.74 | 4.99 | 5.25 | 5.51 | 5.76 | 6.02 |
| Woodie | 1.07 | 2.09 | 3.86 | 4.88 | 6.65 | 7.67 | 9.44 |
| Fibonacci | 1.96 | 3.03 | 3.69 | 4.75 | 5.82 | 6.48 | 7.54 |
| Pivot points | S3 | S2 | S1 | PP | R1 | R2 | R3 |
|---|---|---|---|---|---|---|---|
| Standard | -1.50 | 0.11 | 2.68 | 4.29 | 6.86 | 8.47 | 11.04 |
| Camarilla | 4.10 | 4.48 | 4.87 | 5.25 | 5.63 | 6.02 | 6.40 |
| Woodie | -1.02 | 0.35 | 3.16 | 4.53 | 7.34 | 8.71 | 11.52 |
| Fibonacci | 0.11 | 1.71 | 2.69 | 4.29 | 5.89 | 6.87 | 8.47 |
| Pivot points | S3 | S2 | S1 | PP | R1 | R2 | R3 |
|---|---|---|---|---|---|---|---|
| Standard | -1.15 | 0.12 | 0.95 | 2.22 | 3.05 | 4.32 | 5.15 |
| Camarilla | 1.19 | 1.39 | 1.58 | 1.77 | 1.96 | 2.16 | 2.35 |
| Woodie | -1.38 | 0.01 | 0.72 | 2.11 | 2.82 | 4.21 | 4.92 |
| Fibonacci | 0.12 | 0.93 | 1.42 | 2.22 | 3.03 | 3.52 | 4.32 |
Numerical data
The following are the details of the technical indicators and moving averages that were collected to generate this technical analysis:
| RSI (14): | 93.98 | |
| MACD (12,26,9): | 1.7100 | |
| Directional Movement: | 76.81 | |
| AROON (14): | 100.00 | |
| DEMA (21): | 4.54 | |
| Parabolic SAR (0,02-0,02-0,2): | 1.08 | |
| Elder Ray (13): | 10.12 | |
| Super Trend (3,10): | 7.43 | |
| Zig ZAG (10): | 15.31 | |
| VORTEX (21): | 1.2100 | |
| Stochastique (14,3,5): | 73.83 | |
| TEMA (21): | 5.54 | |
| Williams %R (14): | -12.69 | |
| Chande Momentum Oscillator (20): | 11.76 | |
| Repulse (5,40,3): | 57.4800 | |
| ROCnROLL: | 1 | |
| TRIX (15,9): | 12.7100 | |
| Courbe Coppock: | 2,657.30 |
| MA7: | 4.31 | |
| MA20: | 3.10 | |
| MA50: | 1.90 | |
| MA100: | 1.10 | |
| MAexp7: | 4.96 | |
| MAexp20: | 2.87 | |
| MAexp50: | 3.03 | |
| MAexp100: | 14.08 | |
| Price / MA7: | +264.27% | |
| Price / MA20: | +406.45% | |
| Price / MA50: | +726.32% | |
| Price / MA100: | +1,327.27% | |
| Price / MAexp7: | +216.73% | |
| Price / MAexp20: | +447.39% | |
| Price / MAexp50: | +418.48% | |
| Price / MAexp100: | +11.58% |
News
The latest news and videos published on OCUGEN INC. at the time of the analysis were as follows:
- Ocugen Inc. Announces $23 Million Registered Direct Offering of Common Stock Priced at a Premium to Market
- Ocugen and Bharat Biotech Announce Execution of Definitive Agreement for the Commercialization of COVAXIN™ in the US Market
- Ocugen Inc. Announces the Cancellation of Stockholder Meeting Previously Adjourned to 11:00 a.m. Eastern Time on January 13, 2021
- Ocugen Inc. Regains Compliance with Nasdaq Bid Price Rule
- Ocugen Inc. to Present at CTIC, HC Wainwright and Noble Capital Investor Conferences
About author

Online


Add a comment
Comments
0 comments on the analysis OCUGEN INC. - Weekly