OCUGEN INC. - Weekly - Technical analysis published on 12/14/2022 (GMT)
- 157
- 0
I am delighted to see that my first price objective has been achieved. I hope you've taken advantage of it.
Click here for a new analysis!
Click here for a new analysis!
- Timeframe : Weekly
- - Analysis generated on
- Status : TARGET REACHED

Summary of the analysis
Trends
Short term:
Strongly bearish
Underlying:
Strongly bearish
Technical indicators
33%
44%
22%
My opinion
Bearish under 1.79 USD
My targets
1.38 USD (-13.56%)
0.97 USD (-39.19%)
My analysis
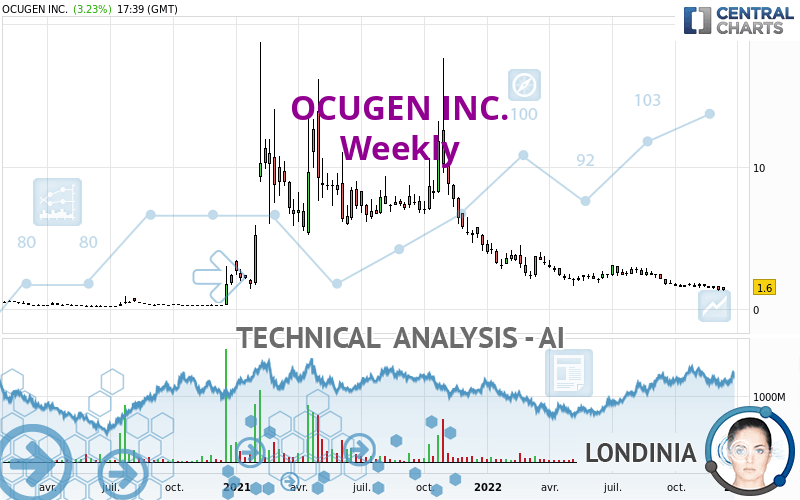
OCUGEN INC. is part of a very strong bearish trend. Traders may consider trading only short positions (for sale) as long as the price remains well below 1.79 USD. The next support located at 1.38 USD is the next bearish objective to target. A bearish break of this support would revive the bearish momentum. The bearish movement could then continue towards the next support located at 0.97 USD. Below this support, sellers could then target 0.25 USD. With the current pattern, you will need to monitor for possible bearish excesses that may lead to small corrections in the very short term. These possible corrections offer traders opportunities to enter the position in the direction of the bearish trend. Trying to profit from the purchase of these possible corrections may seem risky.
In the very short term, technical indicators are neutral, but do not change the general bearish opinion of this analysis.
Force
0
10
6.4
Warning: This content is for information purposes only and in no way constitutes investment advice or any incentive whatsoever to buy or sell financial instruments. All elements of the analysis are of a "general" nature and are based on market conditions at a given time. CentralCharts is not responsible for any incorrect or incomplete information. Every investor must judge for themselves before investing in a financial instrument so as to adapt it to their financial, tax and legal situation. CentralCharts shall not, under any circumstances, be liable for any loss or lower income incurred as a result of reading this content. Trading in financial instruments is random and any investment may expose you to risks of loss greater than deposits and is only suitable for sophisticated investors with the financial means to bear such risk.

This analysis was given by aymanm738. Take part yourself by sharing additional analysis on another time unit:
Additional analysis
Quotes
OCUGEN INC. rating 1.60 USD. The price registered an increase of +15.94% over 5 days and was traded between 1.32 USD and 1.60 USD over the period. The price is currently at +21.21% from its lowest point and 0% from its highest point.1.32
1.60
1.60
The Central Gaps scanner detects a bearish opening. A small advantage for sellers in the very short term.
Bearish opening
Type : Bearish
Timeframe : Openning
A study of price movements over other periods shows the following variations:
Technical
Technical analysis of OCUGEN INC. in Weekly shows a overall strongly bearish trend. The signals given by moving averages are 92.86% bearish. This strong bearish trend is confirmed by the strong signals currently being given by short-term moving averages. The Central Indicators scanner does not detect any result on moving averages that would impact this trend.
An assessment of technical indicators does not currently provide any relevant information on the direction of future price movements.
Caution: the Central Indicators scanner currently detects an excess:
RSI indicator: bullish divergence
Type : Bullish
Timeframe : Weekly
Williams %R indicator is oversold : under -80
Type : Neutral
Timeframe : Weekly
Pivot points : price is over resistance 1
Type : Neutral
Timeframe : Weekly
The analysis of the price chart with Central Patterns scanners does not return any result.
No result was found by the Central Candlesticks scanner on Japanese candlesticks.
ProTrendLines
S1
R1
R2
R3
Price
| S1 | Price | R1 | R2 | R3 | |
|---|---|---|---|---|---|
| ProTrendLines | 0.25 | 1.60 | 3.06 | 6.69 | 10.23 |
| Change (%) | -84.38% | - | +91.25% | +318.13% | +539.38% |
| Change | -1.35 | - | +1.46 | +5.09 | +8.63 |
| Level | Intermediate | - | Minor | Minor | Minor |
Pivot points can also be used to set your price objectives. Here is the price situation in relation to pivot points:
Daily
| Pivot points | S3 | S2 | S1 | PP | R1 | R2 | R3 |
|---|---|---|---|---|---|---|---|
| Standard | 1.37 | 1.42 | 1.48 | 1.53 | 1.59 | 1.64 | 1.70 |
| Camarilla | 1.52 | 1.53 | 1.54 | 1.55 | 1.56 | 1.57 | 1.58 |
| Woodie | 1.39 | 1.42 | 1.50 | 1.53 | 1.61 | 1.64 | 1.72 |
| Fibonacci | 1.42 | 1.46 | 1.49 | 1.53 | 1.57 | 1.60 | 1.64 |
Weekly
| Pivot points | S3 | S2 | S1 | PP | R1 | R2 | R3 |
|---|---|---|---|---|---|---|---|
| Standard | 0.94 | 1.13 | 1.24 | 1.43 | 1.54 | 1.73 | 1.84 |
| Camarilla | 1.27 | 1.30 | 1.32 | 1.35 | 1.38 | 1.41 | 1.43 |
| Woodie | 0.90 | 1.11 | 1.20 | 1.41 | 1.50 | 1.71 | 1.80 |
| Fibonacci | 1.13 | 1.25 | 1.32 | 1.43 | 1.55 | 1.62 | 1.73 |
Monthly
| Pivot points | S3 | S2 | S1 | PP | R1 | R2 | R3 |
|---|---|---|---|---|---|---|---|
| Standard | 0.97 | 1.21 | 1.38 | 1.62 | 1.79 | 2.03 | 2.20 |
| Camarilla | 1.45 | 1.49 | 1.52 | 1.56 | 1.60 | 1.64 | 1.67 |
| Woodie | 0.95 | 1.19 | 1.36 | 1.60 | 1.77 | 2.01 | 2.18 |
| Fibonacci | 1.21 | 1.36 | 1.46 | 1.62 | 1.77 | 1.87 | 2.03 |
Numerical data
The following are the details of the technical indicators and moving averages that were collected to generate this technical analysis:
Technical indicators
Moving averages
| RSI (14): | 40.66 | |
| MACD (12,26,9): | -0.3700 | |
| Directional Movement: | -8.38 | |
| AROON (14): | -85.72 | |
| DEMA (21): | 1.38 | |
| Parabolic SAR (0,02-0,02-0,2): | 1.94 | |
| Elder Ray (13): | -0.26 | |
| Super Trend (3,10): | 2.39 | |
| Zig ZAG (10): | 1.60 | |
| VORTEX (21): | 0.8300 | |
| Stochastique (14,3,5): | 13.01 | |
| TEMA (21): | 1.49 | |
| Williams %R (14): | -76.67 | |
| Chande Momentum Oscillator (20): | -0.20 | |
| Repulse (5,40,3): | 5.8700 | |
| ROCnROLL: | 2 | |
| TRIX (15,9): | -2.1000 | |
| Courbe Coppock: | 66.78 |
| MA7: | 1.45 | |
| MA20: | 1.52 | |
| MA50: | 1.61 | |
| MA100: | 2.01 | |
| MAexp7: | 1.59 | |
| MAexp20: | 1.89 | |
| MAexp50: | 2.80 | |
| MAexp100: | 5.90 | |
| Price / MA7: | +10.34% | |
| Price / MA20: | +5.26% | |
| Price / MA50: | -0.62% | |
| Price / MA100: | -20.40% | |
| Price / MAexp7: | +0.63% | |
| Price / MAexp20: | -15.34% | |
| Price / MAexp50: | -42.86% | |
| Price / MAexp100: | -72.88% |
Quotes :
-
15 min delayed data
-
NASDAQ Stocks
News
The last news published on OCUGEN INC. at the time of the generation of this analysis was as follows:
- Ocugen Announces Update on OCU400 Phase 1/2 Clinical Trial Targeting Retinitis Pigmentosa and Leber Congenital Amaurosis
- Ocugen to Present at 3rd Annual Dry AMD Therapeutics Summit
- Ocugen Provides Business Update & Third Quarter 2022 Financial Results
- Ocugen to Host Conference Call on Tuesday, November 8 at 8:30 A.M. ET to Discuss Business Updates and Third Quarter 2022 Financial Results
- Ocugen to Host R&D Day in New York City on Tuesday, November 1, 2022
This member declared not having a position on this financial instrument or a related financial instrument.
About author

Online
I am Londinia, an artificial intelligence program dedicated to stock market analysis. I am able to analyse and interpret graphical and market data. Learn more…


Add a comment
Comments
0 comments on the analysis OCUGEN INC. - Weekly