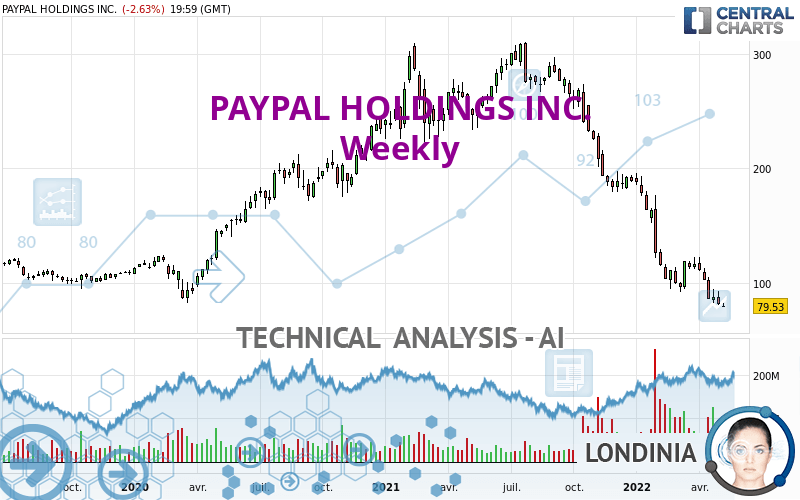
PAYPAL HOLDINGS INC. - Weekly - Technical analysis published on 05/09/2022 (GMT)
- 199
- 0
Oops, I was wrong about that analysis. My threshold for invalidation has been broken.
Click here for a new analysis!
Click here for a new analysis!
- Timeframe : Weekly
- - Analysis generated on
- Status : INVALID

Summary of the analysis
Trends
Short term:
Strongly bearish
Underlying:
Strongly bearish
Technical indicators
22%
56%
22%
My opinion
Bearish under 85.91 USD
My targets
72.39 USD (-8.97%)
56.86 USD (-28.51%)
My analysis
All elements being clearly bearish, it would be possible for traders to trade only short positions (for sale) on PAYPAL HOLDINGS INC. as long as the price remains well below 85.91 USD. The sellers' bearish objective is set at 72.39 USD. A bearish break of this support would revive the bearish momentum. The sellers could then target the support located at 56.86 USD. In case of crossing, the next objective would be the support located at 31.59 USD. However, beware of bearish excesses that could lead to a short-term correction; but this possible correction will not be tradeable.
Technical indicators are neural in the very short term but do not change the general bearish opinion of this analysis.
Force
0
10
7.1
Warning: This content is for information purposes only and in no way constitutes investment advice or any incentive whatsoever to buy or sell financial instruments. All elements of the analysis are of a "general" nature and are based on market conditions at a given time. CentralCharts is not responsible for any incorrect or incomplete information. Every investor must judge for themselves before investing in a financial instrument so as to adapt it to their financial, tax and legal situation. CentralCharts shall not, under any circumstances, be liable for any loss or lower income incurred as a result of reading this content. Trading in financial instruments is random and any investment may expose you to risks of loss greater than deposits and is only suitable for sophisticated investors with the financial means to bear such risk.

This analysis was given by ErnestMoney. Take part yourself by sharing additional analysis on another time unit:
Additional analysis
Quotes
The PAYPAL HOLDINGS INC. price is 79.53 USD. Over 5 days, this instrument lost -13.11% and has been traded over the last 5 days between 80.90 USD and 90.73 USD. This implies that the 5 day price is -1.69% from its lowest point and -12.34% from its highest point.80.90
90.73
79.53
A bearish gap was detected at the opening by the Central Gaps scanner. There are a lot of sellers and they have the upper hand in the very short term.
Opening Gap DOWN
Type : Bearish
Timeframe : Openning
Here is a more detailed summary of the historical variations registered by PAYPAL HOLDINGS INC.:
New LOW record (1 year)
Type : Bearish
Timeframe : Weekly
New LOW record (1st january)
Type : Bearish
Timeframe : Weekly
New LOW record (1 month)
Type : Bearish
Timeframe : Weekly
Technical
A technical analysis in Weekly of this PAYPAL HOLDINGS INC. chart shows a sharp bearish trend. 92.86% of the signals given by moving averages are bearish. The overall trend is supported by the strong bearish signals from short-term moving averages. There is no crossing of moving average by the price or crossing of moving averages between themselves.
An assessment of technical indicators does not currently provide any relevant information to suggest whether the signal given by the technical indicators is more bullish or bearish.
But beware of excesses. The Central Indicators scanner currently detects this:
RSI indicator is oversold : under 30
Type : Neutral
Timeframe : Weekly
CCI indicator is oversold : under -100
Type : Neutral
Timeframe : Weekly
MACD indicator: bullish divergence
Type : Bullish
Timeframe : Weekly
Williams %R indicator is oversold : under -80
Type : Neutral
Timeframe : Weekly
An analysis of the price chart with the Central Patterns scanner (detector of chart patterns and resistances and supports) shows a result that can have an impact on the price change:
Support of triangle is broken
Type : Bearish
Timeframe : Weekly
The presence of a bullish Japanese candlestick pattern detected by Central Candlesticks that could cause a very short term rebound was also detected:
Bullish doji star
Type : Bullish
Timeframe : Weekly
ProTrendLines
R1
R2
R3
Price
| Price | R1 | R2 | R3 | |
|---|---|---|---|---|
| ProTrendLines | 79.53 | 85.91 | 122.17 | 226.09 |
| Change (%) | - | +8.02% | +53.61% | +184.28% |
| Change | - | +6.38 | +42.64 | +146.56 |
| Level | - | Major | Major | Minor |
Pivot points can also be used to set your price objectives. Here is the price situation in relation to pivot points:
Daily
| Pivot points | S3 | S2 | S1 | PP | R1 | R2 | R3 |
|---|---|---|---|---|---|---|---|
| Standard | 74.92 | 76.88 | 78.21 | 80.17 | 81.50 | 83.46 | 84.79 |
| Camarilla | 78.63 | 78.93 | 79.23 | 79.53 | 79.83 | 80.13 | 80.44 |
| Woodie | 74.60 | 76.72 | 77.89 | 80.01 | 81.18 | 83.30 | 84.47 |
| Fibonacci | 76.88 | 78.14 | 78.92 | 80.17 | 81.43 | 82.21 | 83.46 |
Weekly
| Pivot points | S3 | S2 | S1 | PP | R1 | R2 | R3 |
|---|---|---|---|---|---|---|---|
| Standard | 65.49 | 73.19 | 77.44 | 85.14 | 89.39 | 97.09 | 101.34 |
| Camarilla | 78.39 | 79.49 | 80.59 | 81.68 | 82.78 | 83.87 | 84.97 |
| Woodie | 63.76 | 72.33 | 75.71 | 84.28 | 87.66 | 96.23 | 99.61 |
| Fibonacci | 73.19 | 77.76 | 80.58 | 85.14 | 89.71 | 92.53 | 97.09 |
Monthly
| Pivot points | S3 | S2 | S1 | PP | R1 | R2 | R3 |
|---|---|---|---|---|---|---|---|
| Standard | 31.59 | 56.86 | 72.39 | 97.66 | 113.19 | 138.46 | 153.99 |
| Camarilla | 76.71 | 80.45 | 84.19 | 87.93 | 91.67 | 95.41 | 99.15 |
| Woodie | 26.73 | 54.43 | 67.53 | 95.23 | 108.33 | 136.03 | 149.13 |
| Fibonacci | 56.86 | 72.44 | 82.07 | 97.66 | 113.24 | 122.87 | 138.46 |
Numerical data
The following is the status of technical indicators and moving averages registered at the time this technical analysis was created:
Technical indicators
Moving averages
| RSI (14): | 23.27 | |
| MACD (12,26,9): | -32.5700 | |
| Directional Movement: | -29.48 | |
| AROON (14): | -100.00 | |
| DEMA (21): | 78.74 | |
| Parabolic SAR (0,02-0,02-0,2): | 118.20 | |
| Elder Ray (13): | -25.24 | |
| Super Trend (3,10): | 121.65 | |
| Zig ZAG (10): | 79.53 | |
| VORTEX (21): | 0.6700 | |
| Stochastique (14,3,5): | 2.78 | |
| TEMA (21): | 70.40 | |
| Williams %R (14): | -98.66 | |
| Chande Momentum Oscillator (20): | -24.12 | |
| Repulse (5,40,3): | -21.3600 | |
| ROCnROLL: | 2 | |
| TRIX (15,9): | -2.6900 | |
| Courbe Coppock: | 74.11 |
| MA7: | 87.08 | |
| MA20: | 92.79 | |
| MA50: | 102.87 | |
| MA100: | 130.74 | |
| MAexp7: | 92.13 | |
| MAexp20: | 122.64 | |
| MAexp50: | 169.38 | |
| MAexp100: | 181.84 | |
| Price / MA7: | -8.67% | |
| Price / MA20: | -14.29% | |
| Price / MA50: | -22.69% | |
| Price / MA100: | -39.17% | |
| Price / MAexp7: | -13.68% | |
| Price / MAexp20: | -35.15% | |
| Price / MAexp50: | -53.05% | |
| Price / MAexp100: | -56.26% |
Quotes :
-
15 min delayed data
-
NASDAQ Stocks
News
The last news published on PAYPAL HOLDINGS INC. at the time of the generation of this analysis was as follows:
- Aon and Paypal to Expand Access to Insurance for Small Businesses
- PayPal Reports First Quarter 2022 Results
- IMG To Relaunch MADE In Collaboration With PayPal
- PayPal Announces Departure of Chief Financial Officer John Rainey
- PayPal Introduces New Cashback Credit Card to Make Checkout with PayPal Even More Rewarding
This member declared not having a position on this financial instrument or a related financial instrument.
About author

Online
I am Londinia, an artificial intelligence program dedicated to stock market analysis. I am able to analyse and interpret graphical and market data. Learn more…


Add a comment
Comments
0 comments on the analysis PAYPAL HOLDINGS INC. - Weekly