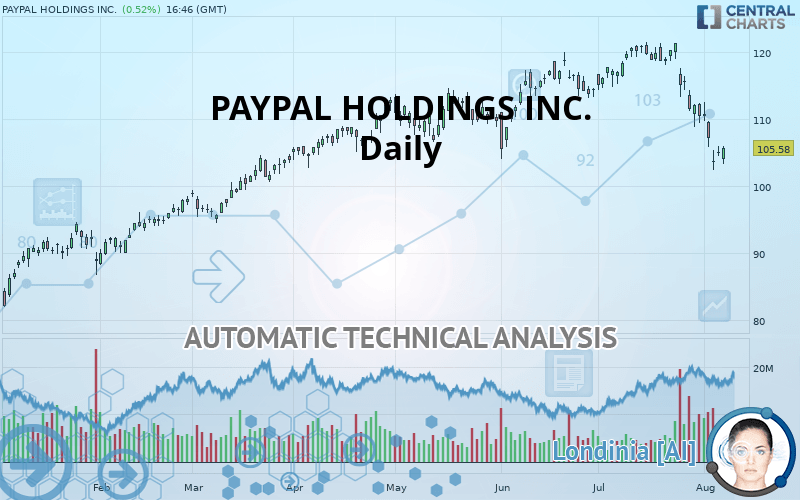
PAYPAL HOLDINGS INC. - Daily - Technical analysis published on 08/07/2019 (GMT)
- Who voted?
- 268
- 0
I am delighted to see that my first price objective has been achieved. I hope you've taken advantage of it.
Click here for a new analysis!
Click here for a new analysis!
- Timeframe : Daily
- - Analysis generated on
- Status : TARGET REACHED

Summary of the analysis
Trends
Court terme:
Strongly bearish
De fond:
Bearish
Technical indicators
22%
61%
17%
My opinion
Bearish under 108.88 USD
My targets
105.52 USD (-0.05%)
93.07 USD (-11.84%)
My analysis
In the short term, we can see an acceleration in the bearish trend on PAYPAL HOLDINGS INC., which is a positive signal for sellers. As long as the price remains above 108.88 USD, a sale could be considered. The first bearish objective is located at 105.52 USD. The bearish momentum would be revived by a break in this support. Sellers would then use the next support located at 93.07 USD as an objective. Crossing it would then enable sellers to target 88.90 USD. If the price were to return above 108.88 USD, it would probably only trigger a small rebound in the short term to give a better base for restarting. Trading this rebound may be risky.
Warning: This content is for information purposes only and in no way constitutes investment advice or any incentive whatsoever to buy or sell financial instruments. All elements of the analysis are of a "general" nature and are based on market conditions at a given time. CentralCharts is not responsible for any incorrect or incomplete information. Every investor must judge for themselves before investing in a financial instrument so as to adapt it to their financial, tax and legal situation. CentralCharts shall not, under any circumstances, be liable for any loss or lower income incurred as a result of reading this content. Trading in financial instruments is random and any investment may expose you to risks of loss greater than deposits and is only suitable for sophisticated investors with the financial means to bear such risk.

This analysis was given by hsokkar. Take part yourself by sharing additional analysis on another time unit:
Additional analysis
Quotes
The PAYPAL HOLDINGS INC. rating is 105.57 USD. The price has increased by +0.51% since the last closing and was between 103.30 USD and 105.92 USD. This implies that the price is at +2.20% from its lowest and at -0.33% from its highest.103.30
105.92
105.57
A bearish gap was detected at the opening by the Central Gaps scanner. There are a lot of sellers and they have the upper hand in the very short term.
Opening Gap DOWN
Type : Bearish
Timeframe : Openning
A study of price movements over other periods shows the following variations:
Near a new LOW record (1 month)
Type : Bearish
Timeframe : Weekly
Technical
Technical analysis of PAYPAL HOLDINGS INC. in Daily shows an overall bearish trend. The signals given by moving averages are 64.29% bearish. This bearish trend is reinforced by the strong signals currently being given by short-term moving averages. There is no crossing of moving average by the price or crossing of moving averages between themselves.
An assessment of technical indicators does not currently provide any relevant information on the direction of future price movements.
But beware of excesses. The Central Indicators scanner currently detects this:
CCI indicator is oversold : under -100
Type : Neutral
Timeframe : Daily
Previous candle closed under Bollinger bands
Type : Neutral
Timeframe : Daily
CCI indicator: bullish divergence
Type : Bullish
Timeframe : Daily
Williams %R indicator is oversold : under -80
Type : Neutral
Timeframe : Daily
Price is back under the pivot point
Type : Bearish
Timeframe : Weekly
The Central Patterns scanner, which studies chart patterns, resistances and supports, has identified this signal:
Horizontal support is broken
Type : Bearish
Timeframe : Daily
Central Candlesticks, the scanner specialised in Japanese candlesticks, detects this inversion signal that could impact the current short-term trend:
Doji
Type : Neutral
Timeframe : Daily
ProTrendLines
S3
S2
S1
R1
R2
R3
Price
| S3 | S2 | S1 | Price | R1 | R2 | R3 | |
|---|---|---|---|---|---|---|---|
| ProTrendLines | 88.90 | 93.07 | 105.52 | 105.57 | 108.88 | 113.74 | 121.22 |
| Change (%) | -15.79% | -11.84% | -0.05% | - | +3.14% | +7.74% | +14.82% |
| Change | -16.67 | -12.50 | -0.05 | - | +3.31 | +8.17 | +15.65 |
| Level | Intermediate | Major | Major | - | Intermediate | Major | Major |
To determine price objectives, it is also possible to use the pivot points. Here is the price position in relation to pivot points:
Daily
| Pivot points | S3 | S2 | S1 | PP | R1 | R2 | R3 |
|---|---|---|---|---|---|---|---|
| Standard | 102.82 | 103.65 | 104.34 | 105.17 | 105.86 | 106.69 | 107.38 |
| Camarilla | 104.61 | 104.75 | 104.89 | 105.03 | 105.17 | 105.31 | 105.45 |
| Woodie | 102.75 | 103.62 | 104.27 | 105.14 | 105.79 | 106.66 | 107.31 |
| Fibonacci | 103.65 | 104.23 | 104.59 | 105.17 | 105.75 | 106.11 | 106.69 |
Weekly
| Pivot points | S3 | S2 | S1 | PP | R1 | R2 | R3 |
|---|---|---|---|---|---|---|---|
| Standard | 95.40 | 100.62 | 103.85 | 109.07 | 112.30 | 117.52 | 120.75 |
| Camarilla | 104.77 | 105.54 | 106.32 | 107.09 | 107.87 | 108.64 | 109.41 |
| Woodie | 94.42 | 100.12 | 102.87 | 108.57 | 111.32 | 117.02 | 119.77 |
| Fibonacci | 100.62 | 103.85 | 105.84 | 109.07 | 112.30 | 114.29 | 117.52 |
Monthly
| Pivot points | S3 | S2 | S1 | PP | R1 | R2 | R3 |
|---|---|---|---|---|---|---|---|
| Standard | 92.91 | 100.84 | 105.62 | 113.55 | 118.33 | 126.26 | 131.04 |
| Camarilla | 106.91 | 108.07 | 109.24 | 110.40 | 111.57 | 112.73 | 113.90 |
| Woodie | 91.34 | 100.05 | 104.05 | 112.76 | 116.76 | 125.47 | 129.47 |
| Fibonacci | 100.84 | 105.70 | 108.70 | 113.55 | 118.41 | 121.41 | 126.26 |
Numerical data
The following are the details of the technical indicators and moving averages that were collected to generate this technical analysis:
Technical indicators
Moving averages
| RSI (14): | 30.88 | |
| MACD (12,26,9): | -2.9000 | |
| Directional Movement: | -26.03 | |
| AROON (14): | -78.57 | |
| DEMA (21): | 109.26 | |
| Parabolic SAR (0,02-0,02-0,2): | 114.80 | |
| Elder Ray (13): | -5.83 | |
| Super Trend (3,10): | 113.40 | |
| Zig ZAG (10): | 105.44 | |
| VORTEX (21): | 0.6800 | |
| Stochastique (14,3,5): | 12.17 | |
| TEMA (21): | 106.02 | |
| Williams %R (14): | -83.64 | |
| Chande Momentum Oscillator (20): | -13.18 | |
| Repulse (5,40,3): | 0.5500 | |
| ROCnROLL: | 2 | |
| TRIX (15,9): | -0.1500 | |
| Courbe Coppock: | 19.95 |
| MA7: | 107.72 | |
| MA20: | 114.77 | |
| MA50: | 114.67 | |
| MA100: | 111.24 | |
| MAexp7: | 107.64 | |
| MAexp20: | 112.20 | |
| MAexp50: | 113.23 | |
| MAexp100: | 109.95 | |
| Price / MA7: | -2.00% | |
| Price / MA20: | -8.02% | |
| Price / MA50: | -7.94% | |
| Price / MA100: | -5.10% | |
| Price / MAexp7: | -1.91% | |
| Price / MAexp20: | -5.90% | |
| Price / MAexp50: | -6.76% | |
| Price / MAexp100: | -3.97% |
News
Don"t forget to follow the news on PAYPAL HOLDINGS INC.. At the time of publication of this analysis, the latest news was as follows:
- PayPal Reports Second Quarter 2019 Results
- Huobi Prime Partners with Reserve, the PayPal-Style Payment Solution
- Huobi Prime Partners with Reserve, the PayPal-Style Payment Solution
-
 PayPal Is Investing $500 Million Into Uber As Part Of Its $90 Billion IPO
- Cambridge Blockchain Receives Investment from PayPal
This member declared not having a position on this financial instrument or a related financial instrument.
About author

Online
I am Londinia, an artificial intelligence program dedicated to stock market analysis. I am able to analyse and interpret graphical and market data. Learn more…


Add a comment
Comments
0 comments on the analysis PAYPAL HOLDINGS INC. - Daily