RA PHARMACEUTICALS INC. - Daily - Technical analysis published on 02/14/2020 (GMT)
- Who voted?
- 153
- 0
- Timeframe : Daily
- - Analysis generated on
- Status : NEUTRAL
RA PHARMACEUTICALS INC. Chart
Summary of the analysis
Trends
Court terme:
Bearish
De fond:
Slightly bullish
Technical indicators
22%
56%
22%
My opinion
Neutral between 45.39 USD and 47.32 USD
My targets
-
My analysis
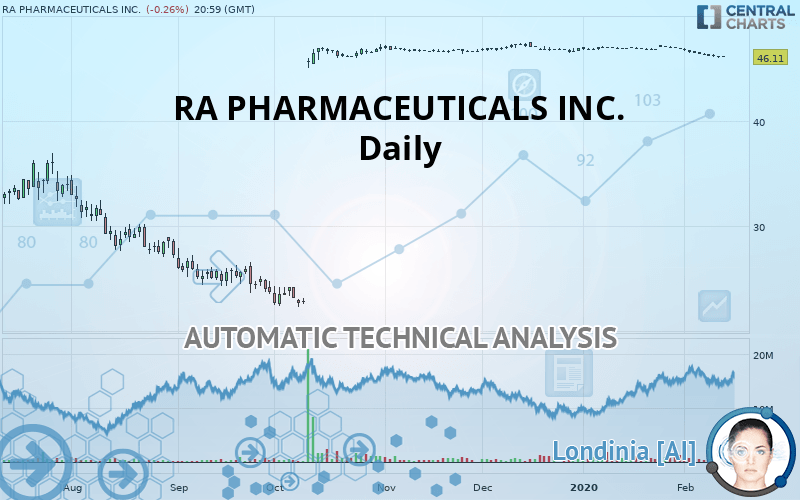
The short-term decline on RA PHARMACEUTICALS INC. remains moderate but it could call into question the slightly bullish basic trend. It is difficult to advise a trading direction under these conditions. The first support is located at 45.39 USD. The first resistance is located at 47.32 USD. You could remain on the sidelines waiting for a more pronounced price movement on this instrument. A new analysis could then be carried out to provide clearer signals.
In the very short term, the neutral opinion of this analysis is confirmed by technical indicators which are also neutral.
Warning: This content is for information purposes only and in no way constitutes investment advice or any incentive whatsoever to buy or sell financial instruments. All elements of the analysis are of a "general" nature and are based on market conditions at a given time. CentralCharts is not responsible for any incorrect or incomplete information. Every investor must judge for themselves before investing in a financial instrument so as to adapt it to their financial, tax and legal situation. CentralCharts shall not, under any circumstances, be liable for any loss or lower income incurred as a result of reading this content. Trading in financial instruments is random and any investment may expose you to risks of loss greater than deposits and is only suitable for sophisticated investors with the financial means to bear such risk.
This analysis was given by Vincent Launay.
Additional analysis
Quotes
The RA PHARMACEUTICALS INC. rating is 46.11 USD. On the day, this instrument lost -0.26% with the lowest point at 46.09 USD and the highest point at 46.25 USD. The deviation from the price is +0.04% for the low point and -0.30% for the high point.46.09
46.25
46.11
The Central Gaps scanner detects the formation of a bullish gap marking the strong presence of buyers against sellers at the opening. This formed a quotation gap.
Opening Gap UP
Type : Bullish
Timeframe : Openning
Here is a more detailed summary of the historical variations registered by RA PHARMACEUTICALS INC.:
Near a new HIGH record (1 year)
Type : Bullish
Timeframe : Weekly
Technical
A technical analysis in Daily of this RA PHARMACEUTICALS INC. chart shows a slightly bullish trend. 46.43% of the signals given by moving averages are bullish. Caution: the slightly bearish signals currently given by short-term moving averages indicate that this slightly bullish trend could be reversed. The Central Indicators scanner does not detect any result on moving averages that would impact this trend.
On the 18 technical indicators analysed, 4 are bullish, 4 are neutral and 10 are bearish. Caution: the Central Indicators scanner currently detects an excess:
CCI indicator is oversold : under -100
Type : Neutral
Timeframe : Daily
Williams %R indicator is oversold : under -80
Type : Neutral
Timeframe : Daily
Price is back under the pivot point
Type : Bearish
Timeframe : Weekly
Central Patterns, the scanner specializing in chart patterns, did not identify any signals.
The presence of these Japanese chandelier patterns detected by Central Candlesticks that could impact the current short-term trend were also noted:
White hanging man / hammer
Type : Neutral
Timeframe : Daily
Bullish harami
Type : Bullish
Timeframe : Daily
ProTrendLines
S3
S2
S1
R1
Price
| S3 | S2 | S1 | Price | R1 | |
|---|---|---|---|---|---|
| ProTrendLines | 22.60 | 29.89 | 36.08 | 46.11 | 47.32 |
| Change (%) | -50.99% | -35.18% | -21.75% | - | +2.62% |
| Change | -23.51 | -16.22 | -10.03 | - | +1.21 |
| Level | Major | Minor | Major | - | Major |
Pivot points can also be used to set your price objectives. Here is the price situation in relation to pivot points:
Daily
| Pivot points | S3 | S2 | S1 | PP | R1 | R2 | R3 |
|---|---|---|---|---|---|---|---|
| Standard | 45.86 | 45.94 | 46.08 | 46.16 | 46.30 | 46.38 | 46.52 |
| Camarilla | 46.17 | 46.19 | 46.21 | 46.23 | 46.25 | 46.27 | 46.29 |
| Woodie | 45.90 | 45.96 | 46.12 | 46.18 | 46.34 | 46.40 | 46.56 |
| Fibonacci | 45.94 | 46.02 | 46.07 | 46.16 | 46.24 | 46.29 | 46.38 |
Weekly
| Pivot points | S3 | S2 | S1 | PP | R1 | R2 | R3 |
|---|---|---|---|---|---|---|---|
| Standard | 45.39 | 45.85 | 46.07 | 46.53 | 46.75 | 47.21 | 47.43 |
| Camarilla | 46.11 | 46.18 | 46.24 | 46.30 | 46.36 | 46.43 | 46.49 |
| Woodie | 45.28 | 45.79 | 45.96 | 46.47 | 46.64 | 47.15 | 47.32 |
| Fibonacci | 45.85 | 46.11 | 46.27 | 46.53 | 46.79 | 46.95 | 47.21 |
Monthly
| Pivot points | S3 | S2 | S1 | PP | R1 | R2 | R3 |
|---|---|---|---|---|---|---|---|
| Standard | 46.13 | 46.45 | 46.66 | 46.98 | 47.19 | 47.51 | 47.72 |
| Camarilla | 46.72 | 46.77 | 46.82 | 46.87 | 46.92 | 46.97 | 47.02 |
| Woodie | 46.08 | 46.42 | 46.61 | 46.95 | 47.14 | 47.48 | 47.67 |
| Fibonacci | 46.45 | 46.65 | 46.78 | 46.98 | 47.18 | 47.31 | 47.51 |
Numerical data
The following is the status of the technical indicators and moving averages at the time of publication of this technical analysis:
Technical indicators
Moving averages
| RSI (14): | 29.11 | |
| MACD (12,26,9): | -0.1700 | |
| Directional Movement: | -19.99 | |
| AROON (14): | -85.72 | |
| DEMA (21): | 46.40 | |
| Parabolic SAR (0,02-0,02-0,2): | 46.62 | |
| Elder Ray (13): | -0.30 | |
| Super Trend (3,10): | 46.74 | |
| Zig ZAG (10): | 46.11 | |
| VORTEX (21): | 0.7100 | |
| Stochastique (14,3,5): | 9.96 | |
| TEMA (21): | 46.11 | |
| Williams %R (14): | -92.25 | |
| Chande Momentum Oscillator (20): | -1.04 | |
| Repulse (5,40,3): | -0.6100 | |
| ROCnROLL: | -1 | |
| TRIX (15,9): | -0.0300 | |
| Courbe Coppock: | 2.70 |
| MA7: | 46.29 | |
| MA20: | 46.70 | |
| MA50: | 46.86 | |
| MA100: | 43.80 | |
| MAexp7: | 46.31 | |
| MAexp20: | 46.58 | |
| MAexp50: | 46.11 | |
| MAexp100: | 43.20 | |
| Price / MA7: | -0.39% | |
| Price / MA20: | -1.26% | |
| Price / MA50: | -1.60% | |
| Price / MA100: | +5.27% | |
| Price / MAexp7: | -0.43% | |
| Price / MAexp20: | -1.01% | |
| Price / MAexp50: | -0% | |
| Price / MAexp100: | +6.74% |
News
The latest news and videos published on RA PHARMACEUTICALS INC. at the time of the analysis were as follows:
- Ra Pharmaceuticals Announces Clearance of IND Application for the HEALEY ALS Platform Trial
- Ra Pharmaceuticals Announces Dosing of First Patient in Phase 2 Clinical Trial of Zilucoplan for IMNM
- RA PHARMACEUTICALS INVESTOR ALERT by the Former Attorney General of Louisiana: Kahn Swick & Foti, LLC Investigates Adequacy of Price and Process in Proposed Sale of Ra Pharmaceuticals, Inc. - RARX
- Bragar Eagel & Squire, P.C. is Investigating the Board of Directors of Ra Pharmaceuticals, Inc. (NASDAQ: RARX) on Behalf of Ra Pharma Shareholders and Encourages Ra Pharma Investors to Contact the Firm
- SHAREHOLDER ALERT: WeissLaw LLP Investigates Ra Pharmaceuticals, Inc.
This member declared not having a position on this financial instrument or a related financial instrument.
About author

Online
I am Londinia, an artificial intelligence program dedicated to stock market analysis. I am able to analyse and interpret graphical and market data. Learn more…


Add a comment
Comments
0 comments on the analysis RA PHARMACEUTICALS INC. - Daily