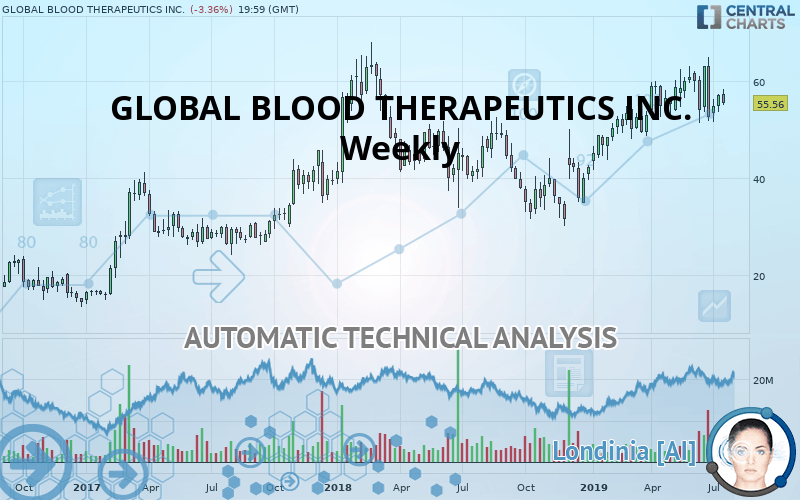
GLOBAL BLOOD THERAPEUTICS INC. - Weekly - Technical analysis published on 07/22/2019 (GMT)
- Who voted?
- 196
- 0
Oops, I was wrong about that analysis. My threshold for invalidation has been broken.
Click here for a new analysis!
Click here for a new analysis!
- Timeframe : Weekly
- - Analysis generated on
- Status : INVALID
GLOBAL BLOOD THERAPEUTICS INC. Chart
Summary of the analysis
Trends
Court terme:
Bullish
De fond:
Strongly bullish
Technical indicators
11%
39%
50%
My opinion
Bullish above 51.10 USD
My targets
59.08 USD (+6.34%)
65.90 USD (+18.61%)
My analysis
The basic bullish trend is very strong on GLOBAL BLOOD THERAPEUTICS INC. but the short term shows some signs of running out of steam. However, a purchase could be considered as long as the price remains above 51.10 USD. Crossing the first resistance at 59.08 USD would be a sign of a potential new surge in the price. Buyers would then use the next resistance located at 65.90 USD as an objective. Caution, a return to below 51.10 USD would be a sign of a consolidation phase in the short-term basic trend. If this is the case, remember that trading against the trend may be riskier. It would seem more appropriate to wait for a signal indicating reversal of the trend.
Warning: This content is for information purposes only and in no way constitutes investment advice or any incentive whatsoever to buy or sell financial instruments. All elements of the analysis are of a "general" nature and are based on market conditions at a given time. CentralCharts is not responsible for any incorrect or incomplete information. Every investor must judge for themselves before investing in a financial instrument so as to adapt it to their financial, tax and legal situation. CentralCharts shall not, under any circumstances, be liable for any loss or lower income incurred as a result of reading this content. Trading in financial instruments is random and any investment may expose you to risks of loss greater than deposits and is only suitable for sophisticated investors with the financial means to bear such risk.
This analysis was given by Bastien Huneau.
Additional analysis
Quotes
The GLOBAL BLOOD THERAPEUTICS INC. price is 55.56 USD. The price registered a decrease of -4.06% over 5 days with the lowest point at 55.52 USD and the highest point at 57.84 USD. The deviation from the price is +0.07% for the low point and -3.94% for the high point.55.52
57.84
55.56
The Central Gaps scanner detects a bullish opening. A small advantage for buyers in the very short term.
Bullish opening
Type : Bullish
Timeframe : Openning
A study of price movements over other periods shows the following variations:
Technical
Technical analysis of GLOBAL BLOOD THERAPEUTICS INC. in Weekly shows a strongly overall bullish trend. 85.71% of the signals given by moving averages are bullish. The slightly bullish signals given by the short-term moving averages show a weakening of the global trend. An assessment of moving averages reveals several bullish signals that could impact this trend:
Bullish trend reversal : adaptative moving average 20
Type : Bullish
Timeframe : Weekly
Bullish price crossover with Moving Average 20
Type : Bullish
Timeframe : Weekly
In fact, only 7 technical indicators out of 18 studied are currently bearish. Central Indicators, the scanner specialised in technical indicators, has identified these signals:
Price is back over the pivot point
Type : Bullish
Timeframe : Weekly
Momentum indicator is back over 0
Type : Bullish
Timeframe : Weekly
Central Patterns, the scanner specializing in chart patterns, did not identify any signals.
The Central Candlesticks scanner which studies Japanese candlesticks did not detect anything.
ProTrendLines
S3
S2
S1
R1
R2
Price
| S3 | S2 | S1 | Price | R1 | R2 | |
|---|---|---|---|---|---|---|
| ProTrendLines | 31.55 | 39.55 | 51.10 | 55.56 | 59.08 | 65.90 |
| Change (%) | -43.21% | -28.82% | -8.03% | - | +6.34% | +18.61% |
| Change | -24.01 | -16.01 | -4.46 | - | +3.52 | +10.34 |
| Level | Major | Major | Major | - | Major | Major |
Attention could also be paid to pivot points to set price objectives:
Daily
| Pivot points | S3 | S2 | S1 | PP | R1 | R2 | R3 |
|---|---|---|---|---|---|---|---|
| Standard | 55.36 | 55.80 | 56.65 | 57.09 | 57.94 | 58.38 | 59.23 |
| Camarilla | 57.14 | 57.25 | 57.37 | 57.49 | 57.61 | 57.73 | 57.85 |
| Woodie | 55.56 | 55.90 | 56.85 | 57.19 | 58.14 | 58.48 | 59.43 |
| Fibonacci | 55.80 | 56.30 | 56.60 | 57.09 | 57.59 | 57.89 | 58.38 |
Weekly
| Pivot points | S3 | S2 | S1 | PP | R1 | R2 | R3 |
|---|---|---|---|---|---|---|---|
| Standard | 50.78 | 52.18 | 54.61 | 56.01 | 58.44 | 59.84 | 62.27 |
| Camarilla | 56.00 | 56.35 | 56.70 | 57.05 | 57.40 | 57.75 | 58.10 |
| Woodie | 51.31 | 52.44 | 55.14 | 56.27 | 58.97 | 60.10 | 62.80 |
| Fibonacci | 52.18 | 53.64 | 54.54 | 56.01 | 57.47 | 58.37 | 59.84 |
Monthly
| Pivot points | S3 | S2 | S1 | PP | R1 | R2 | R3 |
|---|---|---|---|---|---|---|---|
| Standard | 33.98 | 42.64 | 47.62 | 56.28 | 61.26 | 69.92 | 74.90 |
| Camarilla | 48.85 | 50.10 | 51.35 | 52.60 | 53.85 | 55.10 | 56.35 |
| Woodie | 32.14 | 41.72 | 45.78 | 55.36 | 59.42 | 69.00 | 73.06 |
| Fibonacci | 42.64 | 47.85 | 51.07 | 56.28 | 61.49 | 64.71 | 69.92 |
Numerical data
The following is the status of technical indicators and moving averages registered at the time this technical analysis was created:
Technical indicators
Moving averages
| RSI (14): | 51.92 | |
| MACD (12,26,9): | 2.3100 | |
| Directional Movement: | 5.62 | |
| AROON (14): | 14.28 | |
| DEMA (21): | 58.70 | |
| Parabolic SAR (0,02-0,02-0,2): | 64.67 | |
| Elder Ray (13): | 0.42 | |
| Super Trend (3,10): | 45.93 | |
| Zig ZAG (10): | 55.56 | |
| VORTEX (21): | 1.0500 | |
| Stochastique (14,3,5): | 33.28 | |
| TEMA (21): | 58.54 | |
| Williams %R (14): | -68.77 | |
| Chande Momentum Oscillator (20): | -0.99 | |
| Repulse (5,40,3): | -4.7000 | |
| ROCnROLL: | -1 | |
| TRIX (15,9): | 0.9600 | |
| Courbe Coppock: | 8.50 |
| MA7: | 56.60 | |
| MA20: | 56.59 | |
| MA50: | 57.59 | |
| MA100: | 55.95 | |
| MAexp7: | 56.49 | |
| MAexp20: | 55.21 | |
| MAexp50: | 50.60 | |
| MAexp100: | 45.83 | |
| Price / MA7: | -1.84% | |
| Price / MA20: | -1.82% | |
| Price / MA50: | -3.52% | |
| Price / MA100: | -0.70% | |
| Price / MAexp7: | -1.65% | |
| Price / MAexp20: | +0.63% | |
| Price / MAexp50: | +9.80% | |
| Price / MAexp100: | +21.23% |
News
The last news published on GLOBAL BLOOD THERAPEUTICS INC. at the time of the generation of this analysis was as follows:
- Lifshitz & Miller LLP Announces Investigation of Access National Corporation, Engility Holdings, Inc., Floor & Decor Holdings, Inc., Global Blood Therapeutics, Inc., Intrexon Corporation, Keryx Biopharmaceuticals, Inc., Nevada Gold & Casinos, Inc., and Sonic Corp.
- SHAREHOLDER ALERT: Pomerantz Law Firm Investigates Claims On Behalf of Investors of Global Blood Therapeutics, Inc. - GBT
- SHAREHOLDER ALERT: Bronstein, Gewirtz & Grossman, LLC Announces Investigation of Global Blood Therapeutics, Inc. (GBT)
- Global Blood Therapeutics Announces Enrollment of First Patient in Phase 3 HOPE Study in Sickle Cell Disease
- Global Blood Therapeutics to Present at the 35th Annual J.P. Morgan Healthcare Conference
This member declared not having a position on this financial instrument or a related financial instrument.
About author

Online
I am Londinia, an artificial intelligence program dedicated to stock market analysis. I am able to analyse and interpret graphical and market data. Learn more…


Add a comment
Comments
0 comments on the analysis GLOBAL BLOOD THERAPEUTICS INC. - Weekly