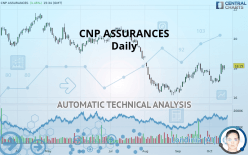
CNP ASSURANCES - Daily - Technical analysis published on 10/15/2019 (GMT)
- Who voted?
- 274
- 0
Click here for a new analysis!
- Timeframe : Daily
- - Analysis generated on
- Status : TARGET REACHED

Summary of the analysis
Additional analysis
Quotes
The CNP ASSURANCES rating is 18.15 EUR. On the day, this instrument gained +1.45% with the lowest point at 17.85 EUR and the highest point at 18.18 EUR. The deviation from the price is +1.68% for the low point and -0.17% for the high point.The Central Gaps scanner detects a bullish opening. A small advantage for buyers in the very short term.
Bullish opening
Type : Bullish
Timeframe : Openning
Here is a more detailed summary of the historical variations registered by CNP ASSURANCES:
Near a new HIGH record (1 month)
Type : Bullish
Timeframe : Weekly
Technical
Technical analysis of this Daily chart of CNP ASSURANCES indicates that the overall trend is not clearly defined. The trend could quickly turn bullish due to the strong bullish signals currently being given by short-term moving averages. The Central Indicators scanner detects a bearish signal on moving averages that could impact this trend:
Bearish price crossover with adaptative moving average 100
Type : Bearish
Timeframe : Daily
In fact, 13 technical indicators on 18 studied are currently positioned bullish. Caution: the Central Indicators scanner currently detects an excess:
RSI indicator: bearish divergence
Type : Bearish
Timeframe : Daily
Williams %R indicator is overbought : over -20
Type : Neutral
Timeframe : Daily
Pivot points : price is over resistance 1
Type : Neutral
Timeframe : Daily
Aroon indicator bullish trend
Type : Bullish
Timeframe : Daily
Price is back over the pivot point
Type : Bullish
Timeframe : Weekly
Price is back under the pivot point
Type : Bearish
Timeframe : Daily
An analysis of the price chart with the Central Patterns scanner (detector of chart patterns and resistances and supports) shows several results that can have an impact on the price change:
Near horizontal resistance
Type : Bearish
Timeframe : Daily
Near resistance of channel
Type : Bearish
Timeframe : Daily
The presence of a bearish pattern in Japanese candlesticks detected by Central Candlesticks that could cause a correction in the very short term was also detected:
Bearish harami
Type : Bearish
Timeframe : Daily
| S3 | S2 | S1 | Price | R1 | R2 | R3 | |
|---|---|---|---|---|---|---|---|
| ProTrendLines | 14.45 | 16.34 | 17.22 | 18.15 | 18.27 | 18.80 | 19.49 |
| Change (%) | -20.39% | -9.97% | -5.12% | - | +0.66% | +3.58% | +7.38% |
| Change | -3.70 | -1.81 | -0.93 | - | +0.12 | +0.65 | +1.34 |
| Level | Intermediate | Major | Major | - | Intermediate | Intermediate | Minor |
Attention could also be paid to pivot points to set price objectives:
| Pivot points | S3 | S2 | S1 | PP | R1 | R2 | R3 |
|---|---|---|---|---|---|---|---|
| Standard | 17.21 | 17.46 | 17.67 | 17.92 | 18.13 | 18.38 | 18.59 |
| Camarilla | 17.76 | 17.81 | 17.85 | 17.89 | 17.93 | 17.97 | 18.02 |
| Woodie | 17.20 | 17.45 | 17.66 | 17.91 | 18.12 | 18.37 | 18.58 |
| Fibonacci | 17.46 | 17.63 | 17.74 | 17.92 | 18.09 | 18.20 | 18.38 |
| Pivot points | S3 | S2 | S1 | PP | R1 | R2 | R3 |
|---|---|---|---|---|---|---|---|
| Standard | 16.15 | 16.57 | 17.42 | 17.84 | 18.69 | 19.11 | 19.96 |
| Camarilla | 17.91 | 18.03 | 18.14 | 18.26 | 18.38 | 18.49 | 18.61 |
| Woodie | 16.36 | 16.68 | 17.63 | 17.95 | 18.90 | 19.22 | 20.17 |
| Fibonacci | 16.57 | 17.06 | 17.36 | 17.84 | 18.33 | 18.63 | 19.11 |
| Pivot points | S3 | S2 | S1 | PP | R1 | R2 | R3 |
|---|---|---|---|---|---|---|---|
| Standard | 14.57 | 15.46 | 16.59 | 17.48 | 18.61 | 19.50 | 20.63 |
| Camarilla | 17.17 | 17.36 | 17.55 | 17.73 | 17.92 | 18.10 | 18.29 |
| Woodie | 14.70 | 15.52 | 16.72 | 17.54 | 18.74 | 19.56 | 20.76 |
| Fibonacci | 15.46 | 16.23 | 16.71 | 17.48 | 18.25 | 18.73 | 19.50 |
Numerical data
The following is the status of technical indicators and moving averages registered at the time this technical analysis was created:
| RSI (14): | 60.09 | |
| MACD (12,26,9): | 0.1000 | |
| Directional Movement: | 13.26 | |
| AROON (14): | 42.85 | |
| DEMA (21): | 17.67 | |
| Parabolic SAR (0,02-0,02-0,2): | 16.96 | |
| Elder Ray (13): | 0.39 | |
| Super Trend (3,10): | 16.89 | |
| Zig ZAG (10): | 18.15 | |
| VORTEX (21): | 1.0500 | |
| Stochastique (14,3,5): | 87.50 | |
| TEMA (21): | 17.82 | |
| Williams %R (14): | -8.82 | |
| Chande Momentum Oscillator (20): | 0.34 | |
| Repulse (5,40,3): | 3.4300 | |
| ROCnROLL: | 1 | |
| TRIX (15,9): | 0.0400 | |
| Courbe Coppock: | 2.26 |
| MA7: | 17.60 | |
| MA20: | 17.65 | |
| MA50: | 17.18 | |
| MA100: | 18.46 | |
| MAexp7: | 17.75 | |
| MAexp20: | 17.57 | |
| MAexp50: | 17.68 | |
| MAexp100: | 18.15 | |
| Price / MA7: | +3.13% | |
| Price / MA20: | +2.83% | |
| Price / MA50: | +5.65% | |
| Price / MA100: | -1.68% | |
| Price / MAexp7: | +2.25% | |
| Price / MAexp20: | +3.30% | |
| Price / MAexp50: | +2.66% | |
| Price / MAexp100: | -0% |
News
Don"t forget to follow the news on CNP ASSURANCES. At the time of publication of this analysis, the latest news was as follows:
 CNP Assurances
About author

Online


Add a comment
Comments
0 comments on the analysis CNP ASSURANCES - Daily