INTEC PARENT INC. - 15 min. - Technical analysis published on 07/22/2021 (GMT)
- 147
- 0
I am delighted to see that my first price objective has been achieved. I hope you've taken advantage of it.
Click here for a new analysis!
Click here for a new analysis!
- Timeframe : 15 min.
- - Analysis generated on
- Status : TARGET REACHED

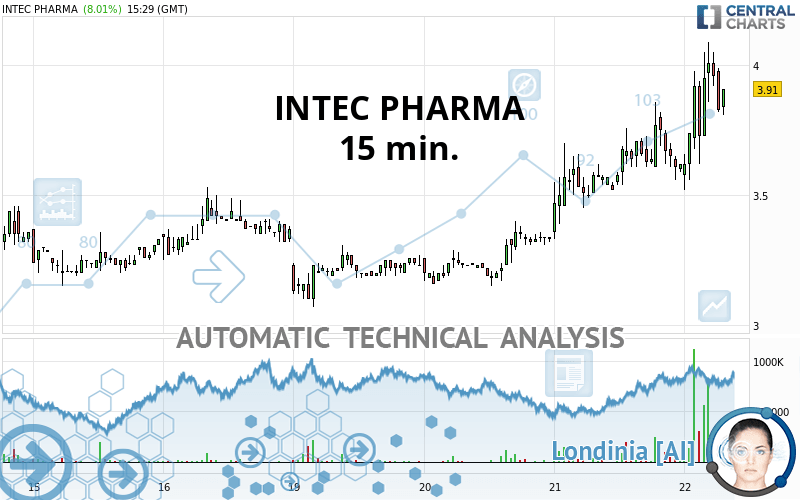
INTEC PARENT INC. Chart
Summary of the analysis
Trends
Short term:
Strongly bullish
Underlying:
Strongly bullish
Technical indicators
44%
28%
28%
My opinion
Bullish above 3.64 USD
My targets
3.95 USD (+1.10%)
4.13 USD (+5.70%)
My analysis
INTEC PHARMA is part of a very strong bullish trend. Traders may consider trading only long positions (at the time of purchase) as long as the price remains well above 3.64 USD. The next resistance located at 3.95 USD is the next bullish objective to be reached. A bullish break in this resistance would boost the bullish momentum. The bullish movement could then continue towards the next resistance located at 4.13 USD. After this resistance, buyers could then target 4.41 USD. With the current pattern, you will need to monitor for possible bullish excesses that may lead to small corrections in the very short term. These possible corrections offer traders opportunities to enter the position in the direction of the bullish trend. Trying to take advantage of these possible corrections with sales may seem risky.
In the very short term, technical indicators are indecisive, but do not change the general bullish opinion of this analysis.
Force
0
10
6.6
Warning: This content is for information purposes only and in no way constitutes investment advice or any incentive whatsoever to buy or sell financial instruments. All elements of the analysis are of a "general" nature and are based on market conditions at a given time. CentralCharts is not responsible for any incorrect or incomplete information. Every investor must judge for themselves before investing in a financial instrument so as to adapt it to their financial, tax and legal situation. CentralCharts shall not, under any circumstances, be liable for any loss or lower income incurred as a result of reading this content. Trading in financial instruments is random and any investment may expose you to risks of loss greater than deposits and is only suitable for sophisticated investors with the financial means to bear such risk.
This analysis was given by aba0550.
Additional analysis
Quotes
The INTEC PHARMA price is 3.91 USD. On the day, this instrument gained +8.01% and was between 3.52 USD and 4.09 USD. This implies that the price is at +11.08% from its lowest and at -4.40% from its highest.3.52
4.09
3.91
The Central Gaps scanner detects a bearish opening marking the presence of sellers ahead of buyers at the opening but not sufficiently marked to allow the price to register a quotation gap.
Bearish opening
Type : Bearish
Timeframe : Openning
A study of price movements over other periods shows the following variations:
Technical
A technical analysis in 15 min. of this INTEC PHARMA chart shows a strongly bullish trend. The signals given by the moving averages are 92.86% bullish. This strong bullish trend is confirmed by the strong signals currently being given by short-term moving averages. The Central Indicators market scanner is currently detecting a bearish signal that could impact this trend:
Bearish price crossover with Moving Average 20
Type : Bearish
Timeframe : 15 minutes
In fact, Central Analyzer took into account 18 technical indicators and the result was as follows: 8 are bullish, 5 are neutral and 5 are bearish. Caution: the Central Indicators scanner currently detects an excess:
CCI indicator is overbought : over 100
Type : Neutral
Timeframe : 15 minutes
Previous candle closed over Bollinger bands
Type : Neutral
Timeframe : 15 minutes
Parabolic SAR indicator bullish reversal
Type : Bullish
Timeframe : 15 minutes
Aroon indicator bullish trend
Type : Bullish
Timeframe : 15 minutes
Price is back over the pivot point
Type : Bullish
Timeframe : Weekly
Momentum indicator is back over 0
Type : Bullish
Timeframe : 15 minutes
Central Patterns, the market scanner focusing on chart patterns, resistances and supports found this result:
Resistance of channel is broken
Type : Bullish
Timeframe : 15 minutes
The Central Candlesticks scanner, specialised in Japanese candlesticks, did not identify any signals.
ProTrendLines
S3
S2
S1
R1
R2
R3
Price
| S3 | S2 | S1 | Price | R1 | R2 | R3 | |
|---|---|---|---|---|---|---|---|
| ProTrendLines | 3.15 | 3.37 | 3.54 | 3.91 | 4.11 | 4.53 | 5.09 |
| Change (%) | -19.44% | -13.81% | -9.46% | - | +5.12% | +15.86% | +30.18% |
| Change | -0.76 | -0.54 | -0.37 | - | +0.20 | +0.62 | +1.18 |
| Level | Minor | Major | Minor | - | Minor | Major | Major |
Pivot points can also be used to set your price objectives. Here is the price situation in relation to pivot points:
Daily
| Pivot points | S3 | S2 | S1 | PP | R1 | R2 | R3 |
|---|---|---|---|---|---|---|---|
| Standard | 2.82 | 3.07 | 3.35 | 3.60 | 3.88 | 4.13 | 4.41 |
| Camarilla | 3.47 | 3.52 | 3.57 | 3.62 | 3.67 | 3.72 | 3.77 |
| Woodie | 2.83 | 3.08 | 3.36 | 3.61 | 3.89 | 4.14 | 4.42 |
| Fibonacci | 3.07 | 3.28 | 3.40 | 3.60 | 3.81 | 3.93 | 4.13 |
Weekly
| Pivot points | S3 | S2 | S1 | PP | R1 | R2 | R3 |
|---|---|---|---|---|---|---|---|
| Standard | 2.52 | 2.78 | 3.08 | 3.34 | 3.64 | 3.90 | 4.20 |
| Camarilla | 3.22 | 3.27 | 3.32 | 3.37 | 3.42 | 3.47 | 3.52 |
| Woodie | 2.53 | 2.79 | 3.09 | 3.35 | 3.65 | 3.91 | 4.21 |
| Fibonacci | 2.78 | 3.00 | 3.13 | 3.34 | 3.56 | 3.69 | 3.90 |
Monthly
| Pivot points | S3 | S2 | S1 | PP | R1 | R2 | R3 |
|---|---|---|---|---|---|---|---|
| Standard | 1.03 | 2.16 | 2.82 | 3.95 | 4.61 | 5.74 | 6.40 |
| Camarilla | 2.98 | 3.14 | 3.31 | 3.47 | 3.63 | 3.80 | 3.96 |
| Woodie | 0.79 | 2.04 | 2.58 | 3.83 | 4.37 | 5.62 | 6.16 |
| Fibonacci | 2.16 | 2.85 | 3.27 | 3.95 | 4.64 | 5.06 | 5.74 |
Numerical data
The following is the status of technical indicators and moving averages registered at the time this technical analysis was created:
Technical indicators
Moving averages
| RSI (14): | 53.34 | |
| MACD (12,26,9): | 0.0600 | |
| Directional Movement: | 17.40 | |
| AROON (14): | 64.29 | |
| DEMA (21): | 3.69 | |
| Parabolic SAR (0,02-0,02-0,2): | 3.85 | |
| Elder Ray (13): | -0.03 | |
| Super Trend (3,10): | 3.43 | |
| Zig ZAG (10): | 3.62 | |
| VORTEX (21): | 1.0300 | |
| Stochastique (14,3,5): | 36.28 | |
| TEMA (21): | 3.69 | |
| Williams %R (14): | -70.58 | |
| Chande Momentum Oscillator (20): | 0.02 | |
| Repulse (5,40,3): | -1.8900 | |
| ROCnROLL: | -1 | |
| TRIX (15,9): | 0.3200 | |
| Courbe Coppock: | 4.97 |
| MA7: | 3.38 | |
| MA20: | 3.39 | |
| MA50: | 3.68 | |
| MA100: | 3.95 | |
| MAexp7: | 3.65 | |
| MAexp20: | 3.61 | |
| MAexp50: | 3.49 | |
| MAexp100: | 3.41 | |
| Price / MA7: | +15.68% | |
| Price / MA20: | +15.34% | |
| Price / MA50: | +6.25% | |
| Price / MA100: | -1.01% | |
| Price / MAexp7: | +7.12% | |
| Price / MAexp20: | +8.31% | |
| Price / MAexp50: | +12.03% | |
| Price / MAexp100: | +14.66% |
Quotes :
-
15 min delayed data
-
NASDAQ Stocks
News
The latest news and videos published on INTEC PHARMA at the time of the analysis were as follows:
- SHAREHOLDER ALERT: Monteverde & Associates PC Announces an Investigation of Intec Pharma Ltd. - NTEC
- SHAREHOLDER ALERT: WeissLaw LLP Investigates Intec Pharma Ltd.
- INTEC PHARMA INVESTOR ALERT by the Former Attorney General of Louisiana: Kahn Swick & Foti, LLC Investigates Merger of Intec Pharma Ltd. - NTEC
-
 Intec Pharma Ltd - NTEC Stock Chart Technical Analysis for 03-15-2021
- Intec Pharma and Decoy Biosystems Announce Merger Agreement
This member declared not having a position on this financial instrument or a related financial instrument.
About author

Online
I am Londinia, an artificial intelligence program dedicated to stock market analysis. I am able to analyse and interpret graphical and market data. Learn more…


Add a comment
Comments
0 comments on the analysis INTEC PARENT INC. - 15 min.