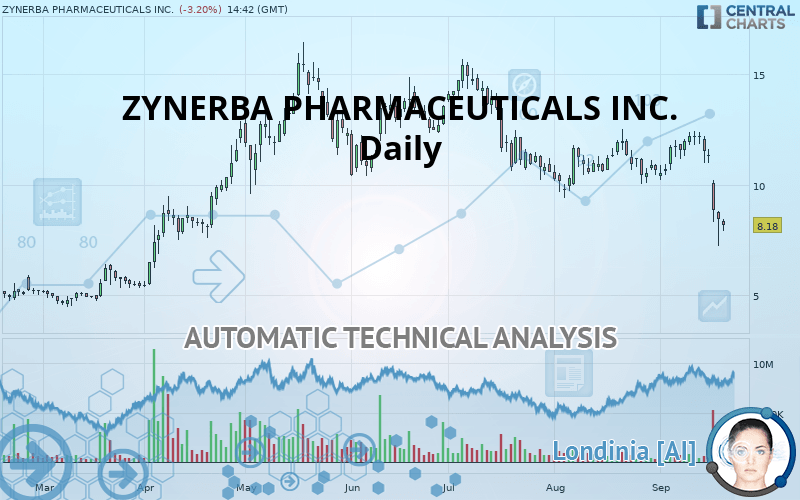
ZYNERBA PHARMACEUTICALS INC. - Daily - Technical analysis published on 09/20/2019 (GMT)
- Who voted?
- 238
- 0
Click here for a new analysis!
- Timeframe : Daily
- - Analysis generated on
- Status : LEVEL MAINTAINED

Summary of the analysis
Additional analysis
Quotes
ZYNERBA PHARMACEUTICALS INC. rating 8.18 USD. The price registered a decrease of -3.20% on the session with the lowest point at 7.92 USD and the highest point at 8.43 USD. The deviation from the price is +3.28% for the low point and -2.97% for the high point.So that you have an overall view of the price change, here is a table showing the variations over several periods:
Technical
Technical analysis of ZYNERBA PHARMACEUTICALS INC. in Daily shows a overall strongly bearish trend. 89.29% of the signals given by moving averages are bearish. The overall trend is supported by the strong bearish signals from short-term moving averages. The Central Indicators scanner does not detect any result on moving averages that would impact this trend.
In fact, according to the parameters integrated into the Central Analyzer system, 10 technical indicators out of 18 analysed are currently bearish. Caution: the Central Indicators scanner currently detects an excess:
CCI indicator is oversold : under -100
Type : Neutral
Timeframe : Daily
Williams %R indicator is oversold : under -80
Type : Neutral
Timeframe : Daily
Pivot points : price is under support 3
Type : Neutral
Timeframe : Weekly
MACD crosses DOWN its Moving Average
Type : Bearish
Timeframe : Daily
Ichimoku - Bearish crossover : Tenkan & Kijun
Type : Bearish
Timeframe : Daily
Price is back over the pivot point
Type : Bullish
Timeframe : Weekly
Price is back under the pivot point
Type : Bearish
Timeframe : Daily
Momentum indicator is back under 0
Type : Bearish
Timeframe : Daily
Williams %R indicator is back under -50
Type : Bearish
Timeframe : Daily
An analysis of the price chart with the Central Patterns scanner (detector of chart patterns and resistances and supports) shows a result that can have an impact on the price change:
Support of channel is broken
Type : Bearish
Timeframe : Daily
The Central Candlesticks scanner currently notes the presence of this pattern in Japanese candlesticks that could mark the end of the short-term trend currently underway:
Black hanging man / hammer
Type : Neutral
Timeframe : Daily
| S3 | S2 | S1 | Price | R1 | R2 | R3 | |
|---|---|---|---|---|---|---|---|
| ProTrendLines | 2.89 | 4.65 | 5.70 | 8.18 | 8.71 | 9.78 | 12.43 |
| Change (%) | -64.67% | -43.15% | -30.32% | - | +6.48% | +19.56% | +51.96% |
| Change | -5.29 | -3.53 | -2.48 | - | +0.53 | +1.60 | +4.25 |
| Level | Intermediate | Minor | Major | - | Minor | Major | Intermediate |
To determine price objectives, it is also possible to use the pivot points. Here is the price position in relation to pivot points:
| Pivot points | S3 | S2 | S1 | PP | R1 | R2 | R3 |
|---|---|---|---|---|---|---|---|
| Standard | 6.14 | 7.22 | 8.03 | 9.12 | 9.93 | 11.01 | 11.82 |
| Camarilla | 8.32 | 8.49 | 8.67 | 8.84 | 9.01 | 9.19 | 9.36 |
| Woodie | 6.00 | 7.15 | 7.89 | 9.05 | 9.79 | 10.94 | 11.68 |
| Fibonacci | 7.22 | 7.95 | 8.39 | 9.12 | 9.84 | 10.29 | 11.01 |
| Pivot points | S3 | S2 | S1 | PP | R1 | R2 | R3 |
|---|---|---|---|---|---|---|---|
| Standard | 10.20 | 10.70 | 11.44 | 11.94 | 12.68 | 13.18 | 13.92 |
| Camarilla | 11.85 | 11.96 | 12.08 | 12.19 | 12.30 | 12.42 | 12.53 |
| Woodie | 10.33 | 10.76 | 11.57 | 12.00 | 12.81 | 13.24 | 14.05 |
| Fibonacci | 10.70 | 11.17 | 11.46 | 11.94 | 12.41 | 12.70 | 13.18 |
| Pivot points | S3 | S2 | S1 | PP | R1 | R2 | R3 |
|---|---|---|---|---|---|---|---|
| Standard | 6.13 | 7.77 | 9.23 | 10.87 | 12.33 | 13.97 | 15.43 |
| Camarilla | 9.84 | 10.12 | 10.41 | 10.69 | 10.97 | 11.26 | 11.54 |
| Woodie | 6.04 | 7.73 | 9.14 | 10.83 | 12.24 | 13.93 | 15.34 |
| Fibonacci | 7.77 | 8.95 | 9.69 | 10.87 | 12.05 | 12.79 | 13.97 |
Numerical data
The following is the status of technical indicators and moving averages registered at the time this technical analysis was created:
| RSI (14): | 28.92 | |
| MACD (12,26,9): | -0.3100 | |
| Directional Movement: | -27.05 | |
| AROON (14): | -35.71 | |
| DEMA (21): | 10.63 | |
| Parabolic SAR (0,02-0,02-0,2): | 12.35 | |
| Elder Ray (13): | -2.77 | |
| Super Trend (3,10): | 11.11 | |
| Zig ZAG (10): | 8.45 | |
| VORTEX (21): | 0.8000 | |
| Stochastique (14,3,5): | 29.61 | |
| TEMA (21): | 10.48 | |
| Williams %R (14): | -76.25 | |
| Chande Momentum Oscillator (20): | -2.09 | |
| Repulse (5,40,3): | -6.7900 | |
| ROCnROLL: | 2 | |
| TRIX (15,9): | -0.0300 | |
| Courbe Coppock: | 3.31 |
| MA7: | 10.95 | |
| MA20: | 11.04 | |
| MA50: | 11.27 | |
| MA100: | 12.20 | |
| MAexp7: | 10.33 | |
| MAexp20: | 10.95 | |
| MAexp50: | 11.30 | |
| MAexp100: | 11.01 | |
| Price / MA7: | -25.30% | |
| Price / MA20: | -25.91% | |
| Price / MA50: | -27.42% | |
| Price / MA100: | -32.95% | |
| Price / MAexp7: | -20.81% | |
| Price / MAexp20: | -25.30% | |
| Price / MAexp50: | -27.61% | |
| Price / MAexp100: | -25.70% |
News
Don"t forget to follow the news on ZYNERBA PHARMACEUTICALS INC.. At the time of publication of this analysis, the latest news was as follows:
-
 Zynerba Pharmaceuticals, Inc. - ZYNE Stock Chart Technical Analysis for 07-05-2019
-
Zynerba Pharmaceuticals, Inc. - ZYNE Stock Chart Technical Analysis for 06-11-2019
-
Zynerba Pharmaceuticals, Inc. - ZYNE Stock Chart Technical Analysis for 05-29-2019
-
Zynerba Pharmaceuticals, Inc. - ZYNE Stock Chart Technical Analysis for 05-16-2019
-
Zynerba Pharmaceuticals, Inc. - ZYNE Stock Chart Technical Analysis for 05-07-2019
About author

Online


Add a comment
Comments
0 comments on the analysis ZYNERBA PHARMACEUTICALS INC. - Daily