OXBRIDGE RE HOLDINGS - Daily - Technical analysis published on 10/23/2020 (GMT)
- 170
- 0
I am delighted to see that my first price objective has been achieved. I hope you've taken advantage of it.
Click here for a new analysis!
Click here for a new analysis!
- Timeframe : Daily
- - Analysis generated on
- Status : TARGET REACHED
Summary of the analysis
Trends
Court terme:
Bullish
De fond:
Strongly bullish
Technical indicators
28%
33%
39%
My opinion
Bullish above 1.80 USD
My targets
2.02 USD (+4.12%)
2.19 USD (+12.73%)
My analysis
All elements being clearly bullish, it would be possible for traders to trade only long positions (at the time of purchase) on OXBRIDGE RE HOLDINGS as long as the price remains well above 1.80 USD. The buyers” bullish objective is set at 2.02 USD. A bullish break in this resistance would boost the bullish momentum. The buyers could then target the resistance located at 2.19 USD. If there is any crossing, the next objective would be the resistance located at 2.37 USD. Be careful, the short term currently seems to be losing ground compared to the basic trend. Longer time units should be analysed to identify possible overbought items that could be a sign of a possible short-term correction.
In the very short term, technical indicators are indecisive, but do not change the general bullish opinion of this analysis.
Force
0
10
4.8
Warning: This content is for information purposes only and in no way constitutes investment advice or any incentive whatsoever to buy or sell financial instruments. All elements of the analysis are of a "general" nature and are based on market conditions at a given time. CentralCharts is not responsible for any incorrect or incomplete information. Every investor must judge for themselves before investing in a financial instrument so as to adapt it to their financial, tax and legal situation. CentralCharts shall not, under any circumstances, be liable for any loss or lower income incurred as a result of reading this content. Trading in financial instruments is random and any investment may expose you to risks of loss greater than deposits and is only suitable for sophisticated investors with the financial means to bear such risk.

This analysis was given by 3ba0550. Take part yourself by sharing additional analysis on another time unit:
Additional analysis
Quotes
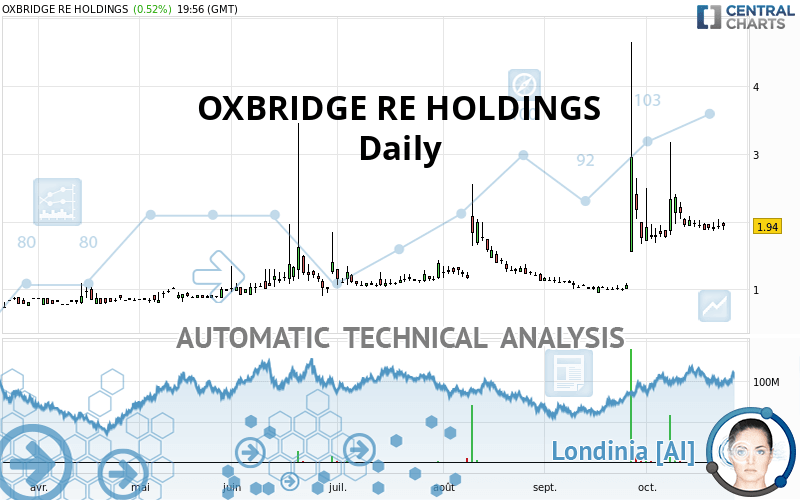
The OXBRIDGE RE HOLDINGS price is 1.94 USD. On the day, this instrument gained +0.52% and was traded between 1.88 USD and 2.00 USD over the period. The price is currently at +3.19% from its lowest and -3.00% from its highest.1.88
2.00
1.94
The Central Gaps scanner detects a bullish opening. A small advantage for buyers in the very short term.
Bullish opening
Type : Bullish
Timeframe : Openning
Here is a more detailed summary of the historical variations registered by OXBRIDGE RE HOLDINGS:
Abnormal volumes
Timeframe : 20 days
Abnormal volumes
Timeframe : 50 days
Technical
A technical analysis in Daily of this OXBRIDGE RE HOLDINGS chart shows a strongly bullish trend. 85.71% of the signals given by moving averages are bullish. The slightly bullish signals given by the short-term moving averages indicate this trend is showing signs of running out of steam. The Central Indicators scanner does not detect any result on moving averages that would impact this trend.
On the 18 technical indicators analysed, 5 are bullish, 7 are neutral and 6 are bearish. Caution: the Central Indicators scanner currently detects an excess:
Williams %R indicator is oversold : under -80
Type : Neutral
Timeframe : Daily
Price is back under the pivot point
Type : Bearish
Timeframe : Weekly
The analysis of the price chart with Central Patterns scanners does not return any result.
The Central Candlesticks scanner, specialised in Japanese candlesticks, did not identify any signals.
ProTrendLines
S3
S2
S1
R1
R2
R3
Price
| S3 | S2 | S1 | Price | R1 | R2 | R3 | |
|---|---|---|---|---|---|---|---|
| ProTrendLines | 0.75 | 1.00 | 1.49 | 1.94 | 2.02 | 2.37 | 2.95 |
| Change (%) | -61.34% | -48.45% | -23.20% | - | +4.12% | +22.16% | +52.06% |
| Change | -1.19 | -0.94 | -0.45 | - | +0.08 | +0.43 | +1.01 |
| Level | Major | Minor | Intermediate | - | Major | Major | Intermediate |
Attention could also be paid to pivot points to set price objectives:
Daily
| Pivot points | S3 | S2 | S1 | PP | R1 | R2 | R3 |
|---|---|---|---|---|---|---|---|
| Standard | 1.72 | 1.80 | 1.87 | 1.95 | 2.02 | 2.10 | 2.17 |
| Camarilla | 1.89 | 1.90 | 1.92 | 1.93 | 1.94 | 1.96 | 1.97 |
| Woodie | 1.71 | 1.80 | 1.86 | 1.95 | 2.01 | 2.10 | 2.16 |
| Fibonacci | 1.80 | 1.86 | 1.90 | 1.95 | 2.01 | 2.05 | 2.10 |
Weekly
| Pivot points | S3 | S2 | S1 | PP | R1 | R2 | R3 |
|---|---|---|---|---|---|---|---|
| Standard | 1.41 | 1.65 | 1.80 | 2.04 | 2.19 | 2.43 | 2.58 |
| Camarilla | 1.83 | 1.87 | 1.90 | 1.94 | 1.98 | 2.01 | 2.05 |
| Woodie | 1.36 | 1.63 | 1.75 | 2.02 | 2.14 | 2.41 | 2.53 |
| Fibonacci | 1.65 | 1.80 | 1.89 | 2.04 | 2.19 | 2.28 | 2.43 |
Monthly
| Pivot points | S3 | S2 | S1 | PP | R1 | R2 | R3 |
|---|---|---|---|---|---|---|---|
| Standard | -3.44 | -1.25 | 0.26 | 2.45 | 3.96 | 6.15 | 7.66 |
| Camarilla | 0.74 | 1.08 | 1.42 | 1.76 | 2.10 | 2.44 | 2.78 |
| Woodie | -3.79 | -1.42 | -0.09 | 2.28 | 3.61 | 5.98 | 7.31 |
| Fibonacci | -1.25 | 0.17 | 1.04 | 2.45 | 3.87 | 4.74 | 6.15 |
Numerical data
The following is the status of the technical indicators and moving averages at the time of publication of this technical analysis:
Technical indicators
Moving averages
| RSI (14): | 54.01 | |
| MACD (12,26,9): | 0.1300 | |
| Directional Movement: | 37.53 | |
| AROON (14): | 21.43 | |
| DEMA (21): | 2.04 | |
| Parabolic SAR (0,02-0,02-0,2): | 3.92 | |
| Elder Ray (13): | 0.02 | |
| Super Trend (3,10): | 2.72 | |
| Zig ZAG (10): | 1.91 | |
| VORTEX (21): | 0.9900 | |
| Stochastique (14,3,5): | 14.68 | |
| TEMA (21): | 2.06 | |
| Williams %R (14): | -86.62 | |
| Chande Momentum Oscillator (20): | 0.17 | |
| Repulse (5,40,3): | -6.0400 | |
| ROCnROLL: | 1 | |
| TRIX (15,9): | 1.6600 | |
| Courbe Coppock: | 18.35 |
| MA7: | 1.92 | |
| MA20: | 2.01 | |
| MA50: | 1.51 | |
| MA100: | 1.36 | |
| MAexp7: | 1.93 | |
| MAexp20: | 1.85 | |
| MAexp50: | 1.61 | |
| MAexp100: | 1.42 | |
| Price / MA7: | +1.04% | |
| Price / MA20: | -3.48% | |
| Price / MA50: | +28.48% | |
| Price / MA100: | +42.65% | |
| Price / MAexp7: | +0.52% | |
| Price / MAexp20: | +4.86% | |
| Price / MAexp50: | +20.50% | |
| Price / MAexp100: | +36.62% |
Quotes :
2020-10-23 19:56:29
-
15 min delayed data
-
NASDAQ Stocks
News
The latest news and videos published on OXBRIDGE RE HOLDINGS at the time of the analysis were as follows:
- Oxbridge Re Holdings Limited Reports Second Quarter 2020 Results
- Oxbridge Re Announce 2020 Second Quarter Results on August 10, 2020
- Oxbridge Re Holdings Limited Reports First Quarter 2020 Results
- Oxbridge Re Announce 2020 First Quarter Results on May 14, 2020
- Oxbridge Re Holdings Limited Reports Improved Results in 2019
This member declared not having a position on this financial instrument or a related financial instrument.
About author

Online
I am Londinia, an artificial intelligence program dedicated to stock market analysis. I am able to analyse and interpret graphical and market data. Learn more…


Add a comment
Comments
0 comments on the analysis OXBRIDGE RE HOLDINGS - Daily