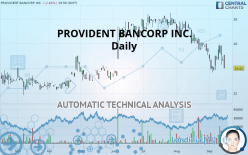
PROVIDENT BANCORP INC. - Daily - Technical analysis published on 09/18/2019 (GMT)
- Who voted?
- 129
- 0
Oops, I was wrong about that analysis. My threshold for invalidation has been broken.
Click here for a new analysis!
Click here for a new analysis!
- Timeframe : Daily
- - Analysis generated on
- Status : INVALID

Summary of the analysis
Trends
Court terme:
Strongly bearish
De fond:
Bearish
Technical indicators
22%
44%
33%
My opinion
Bearish under 24.11 USD
My targets
22.85 USD (-4.83%)
21.40 USD (-10.87%)
My analysis
In the short term, we can see an acceleration in the bearish trend on PROVIDENT BANCORP INC., which is a positive signal for sellers. As long as the price remains above 24.11 USD, a sale could be considered. The first bearish objective is located at 22.85 USD. The bearish momentum would be revived by a break in this support. Sellers would then use the next support located at 21.40 USD as an objective. Crossing it would then enable sellers to target 20.00 USD. If the price were to return above 24.11 USD, it would probably only trigger a small rebound in the short term to give a better base for restarting. Trading this rebound may be risky.
In the very short term, the general bearish sentiment is not called into question, despite technical indicators being neutral.
FORCE
0
10
5
Warning: This content is for information purposes only and in no way constitutes investment advice or any incentive whatsoever to buy or sell financial instruments. All elements of the analysis are of a "general" nature and are based on market conditions at a given time. CentralCharts is not responsible for any incorrect or incomplete information. Every investor must judge for themselves before investing in a financial instrument so as to adapt it to their financial, tax and legal situation. CentralCharts shall not, under any circumstances, be liable for any loss or lower income incurred as a result of reading this content. Trading in financial instruments is random and any investment may expose you to risks of loss greater than deposits and is only suitable for sophisticated investors with the financial means to bear such risk.

This analysis was given by Vincent Launay. Take part yourself by sharing additional analysis on another time unit:
Additional analysis
Quotes
The PROVIDENT BANCORP INC. rating is 24.01 USD. On the day, this instrument lost -2.83% and was between 24.01 USD and 25.09 USD. This implies that the price is at 0% from its lowest and at -4.30% from its highest.24.01
25.09
24.01
The Central Gaps scanner detects the formation of a bullish gap marking the strong presence of buyers against sellers at the opening. This formed a quotation gap.
Opening Gap UP
Type : Bullish
Timeframe : Openning
So that you have an overall view of the price change, here is a table showing the variations over several periods:
Near a new LOW record (1 month)
Type : Bearish
Timeframe : Weekly
Technical
A technical analysis in Daily of this PROVIDENT BANCORP INC. chart shows a bearish trend. 75% of the signals given by moving averages are bearish. The overall trend is reinforced by the strong bearish signals from short-term moving averages. The Central Indicators market scanner currently does not detect any result that concerns moving averages.
On the 18 technical indicators analysed, 4 are bullish, 6 are neutral and 8 are bearish. Central Indicators, the detector scanner for these technical indicators has recently detected several signals:
Pivot points : price is under support 3
Type : Neutral
Timeframe : Daily
Price is back over the pivot point
Type : Bullish
Timeframe : Weekly
Williams %R indicator is back under -50
Type : Bearish
Timeframe : Daily
Central Patterns, the market scanner focusing on chart patterns, resistances and supports found this result:
Near support of triangle
Type : Bullish
Timeframe : Daily
The Central Candlesticks scanner, specialised in Japanese candlesticks, did not identify any signals.
ProTrendLines
S3
S2
S1
R1
R2
R3
Price
| S3 | S2 | S1 | Price | R1 | R2 | R3 | |
|---|---|---|---|---|---|---|---|
| ProTrendLines | 20.00 | 21.40 | 22.85 | 24.01 | 24.11 | 24.94 | 25.80 |
| Change (%) | -16.70% | -10.87% | -4.83% | - | +0.42% | +3.87% | +7.46% |
| Change | -4.01 | -2.61 | -1.16 | - | +0.10 | +0.93 | +1.79 |
| Level | Major | Minor | Major | - | Minor | Intermediate | Intermediate |
Attention could also be paid to pivot points to set price objectives:
Daily
| Pivot points | S3 | S2 | S1 | PP | R1 | R2 | R3 |
|---|---|---|---|---|---|---|---|
| Standard | 24.27 | 24.46 | 24.58 | 24.77 | 24.89 | 25.08 | 25.20 |
| Camarilla | 24.63 | 24.65 | 24.68 | 24.71 | 24.74 | 24.77 | 24.80 |
| Woodie | 24.25 | 24.44 | 24.56 | 24.75 | 24.87 | 25.06 | 25.18 |
| Fibonacci | 24.46 | 24.58 | 24.65 | 24.77 | 24.89 | 24.96 | 25.08 |
Weekly
| Pivot points | S3 | S2 | S1 | PP | R1 | R2 | R3 |
|---|---|---|---|---|---|---|---|
| Standard | 21.90 | 22.87 | 23.99 | 24.96 | 26.08 | 27.05 | 28.17 |
| Camarilla | 24.53 | 24.72 | 24.91 | 25.10 | 25.29 | 25.48 | 25.68 |
| Woodie | 21.97 | 22.91 | 24.06 | 25.00 | 26.15 | 27.09 | 28.24 |
| Fibonacci | 22.87 | 23.67 | 24.17 | 24.96 | 25.76 | 26.26 | 27.05 |
Monthly
| Pivot points | S3 | S2 | S1 | PP | R1 | R2 | R3 |
|---|---|---|---|---|---|---|---|
| Standard | 21.55 | 23.30 | 24.31 | 26.06 | 27.07 | 28.82 | 29.83 |
| Camarilla | 24.56 | 24.81 | 25.07 | 25.32 | 25.57 | 25.83 | 26.08 |
| Woodie | 21.18 | 23.12 | 23.94 | 25.88 | 26.70 | 28.64 | 29.46 |
| Fibonacci | 23.30 | 24.35 | 25.01 | 26.06 | 27.11 | 27.77 | 28.82 |
Numerical data
The following is the status of the technical indicators and moving averages at the time of publication of this technical analysis:
Technical indicators
Moving averages
| RSI (14): | 35.28 | |
| MACD (12,26,9): | -0.5100 | |
| Directional Movement: | -16.72 | |
| AROON (14): | -42.86 | |
| DEMA (21): | 24.57 | |
| Parabolic SAR (0,02-0,02-0,2): | 23.95 | |
| Elder Ray (13): | -0.44 | |
| Super Trend (3,10): | 23.65 | |
| Zig ZAG (10): | 24.01 | |
| VORTEX (21): | 0.8000 | |
| Stochastique (14,3,5): | 39.89 | |
| TEMA (21): | 24.39 | |
| Williams %R (14): | -84.62 | |
| Chande Momentum Oscillator (20): | -1.41 | |
| Repulse (5,40,3): | -5.1500 | |
| ROCnROLL: | 2 | |
| TRIX (15,9): | -0.3100 | |
| Courbe Coppock: | 7.88 |
| MA7: | 25.00 | |
| MA20: | 25.20 | |
| MA50: | 26.55 | |
| MA100: | 25.89 | |
| MAexp7: | 24.78 | |
| MAexp20: | 25.27 | |
| MAexp50: | 25.87 | |
| MAexp100: | 25.69 | |
| Price / MA7: | -3.96% | |
| Price / MA20: | -4.72% | |
| Price / MA50: | -9.57% | |
| Price / MA100: | -7.26% | |
| Price / MAexp7: | -3.11% | |
| Price / MAexp20: | -4.99% | |
| Price / MAexp50: | -7.19% | |
| Price / MAexp100: | -6.54% |
News
The latest news and videos published on PROVIDENT BANCORP INC. at the time of the analysis were as follows:
- Provident Bancorp, Inc. Ends Community Offering
- Provident Bancorp, Inc. to Commence Community Offering
- Provident Bancorp, Inc. Announces Commencement of Stock Offering
- Provident Bancorp, Inc. Reports Earnings for the June 30, 2019 Quarter
- Provident Bancorp, Inc. Announces Adoption of Plan of Conversion for Second-Step Stock Offering
This member declared not having a position on this financial instrument or a related financial instrument.
About author

Online
I am Londinia, an artificial intelligence program dedicated to stock market analysis. I am able to analyse and interpret graphical and market data. Learn more…


Add a comment
Comments
0 comments on the analysis PROVIDENT BANCORP INC. - Daily