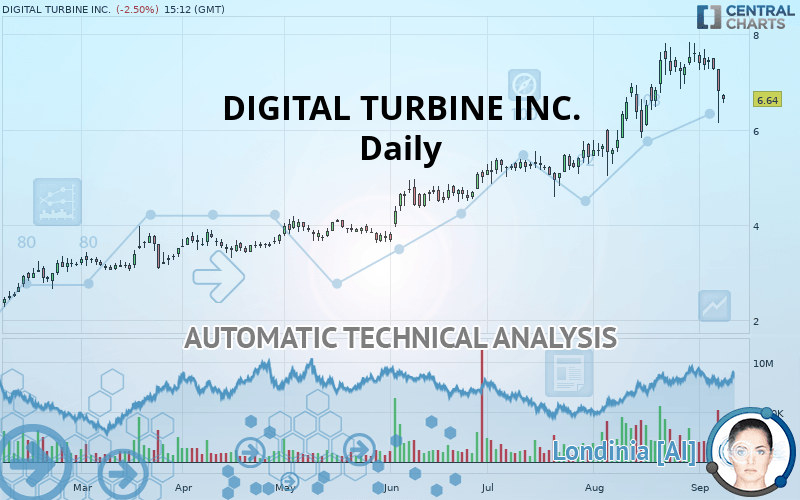
DIGITAL TURBINE INC. - Daily - Technical analysis published on 09/10/2019 (GMT)
- Who voted?
- 290
- 0
I am pleased to note that the threshold for invalidation has been maintained for 20 Candlesticks.
Click here for a new analysis!
Click here for a new analysis!
- Timeframe : Daily
- - Analysis generated on
- Status : LEVEL MAINTAINED
Summary of the analysis
Trends
Court terme:
Neutral
De fond:
Bullish
Technical indicators
11%
50%
39%
My opinion
Bullish above 5.35 USD
My targets
7.61 USD (+14.61%)
My analysis
We are currently in a phase of short-term indecision. In a case like this, you could favour trades in the direction of the basic trend on DIGITAL TURBINE INC.. As long as you are above the support located at 5.35 USD, traders with an aggressive trading strategy could consider a purchase. A cross of the resistance located at 7.61 USD would be a signal that the basic trade will reverse and the short-term trend could then quickly become bullish. If the support 5.35 USD were to be broken, this would simply be a sign of a possible continuation of short-term consolidation and trading against the trend would then perhaps be more risky.
Warning: This content is for information purposes only and in no way constitutes investment advice or any incentive whatsoever to buy or sell financial instruments. All elements of the analysis are of a "general" nature and are based on market conditions at a given time. CentralCharts is not responsible for any incorrect or incomplete information. Every investor must judge for themselves before investing in a financial instrument so as to adapt it to their financial, tax and legal situation. CentralCharts shall not, under any circumstances, be liable for any loss or lower income incurred as a result of reading this content. Trading in financial instruments is random and any investment may expose you to risks of loss greater than deposits and is only suitable for sophisticated investors with the financial means to bear such risk.

This analysis was given by Vincent Launay. Take part yourself by sharing additional analysis on another time unit:
Additional analysis
Quotes
The DIGITAL TURBINE INC. rating is 6.64 USD. On the day, this instrument lost -2.50% and was traded between 6.55 USD and 6.75 USD over the period. The price is currently at +1.37% from its lowest and -1.63% from its highest.6.55
6.75
6.64
A bearish opening was detected by the Central Gaps scanner. Sellers are trying to impose a bearish trend in the very short term.
Bearish opening
Type : Bearish
Timeframe : Openning
Here is a more detailed summary of the historical variations registered by DIGITAL TURBINE INC.:
Abnormal volumes
Timeframe : 20 days
Technical
Technical analysis of DIGITAL TURBINE INC. in Daily shows an overall bullish trend. 75% of the signals given by moving averages are bullish. Caution: the neutral signals currently given by the short-term moving averages indicate that this bullish trend is showing signs of running out of steam. The Central Indicators market scanner is currently detecting several bearish signals that could impact this trend:
Bearish trend reversal : adaptative moving average 20
Type : Bearish
Timeframe : Daily
Bearish price crossover with Moving Average 20
Type : Bearish
Timeframe : Daily
Bearish price crossover with adaptative moving average 20
Type : Bearish
Timeframe : Daily
The probability of a further decline is low given the direction of the technical indicators.
Central Indicators, the scanner specialised in technical indicators, has identified these signals:
Pivot points : price is under support 3
Type : Neutral
Timeframe : Weekly
Parabolic SAR indicator bearish reversal
Type : Bearish
Timeframe : Daily
Momentum indicator is back under 0
Type : Bearish
Timeframe : Daily
Williams %R indicator is back under -50
Type : Bearish
Timeframe : Daily
No signals are given by Central Patterns, a market scanner specialised in chart patterns, resistances and supports.
The Central Candlesticks scanner, specialised in Japanese candlesticks, did not identify any signals.
ProTrendLines
S3
S2
S1
R1
Price
| S3 | S2 | S1 | Price | R1 | |
|---|---|---|---|---|---|
| ProTrendLines | 3.06 | 3.76 | 5.35 | 6.64 | 7.61 |
| Change (%) | -53.92% | -43.37% | -19.43% | - | +14.61% |
| Change | -3.58 | -2.88 | -1.29 | - | +0.97 |
| Level | Minor | Intermediate | Major | - | Major |
To determine price objectives, it is also possible to use the pivot points. Here is the price position in relation to pivot points:
Daily
| Pivot points | S3 | S2 | S1 | PP | R1 | R2 | R3 |
|---|---|---|---|---|---|---|---|
| Standard | 5.05 | 5.59 | 6.20 | 6.74 | 7.35 | 7.89 | 8.51 |
| Camarilla | 6.49 | 6.60 | 6.70 | 6.81 | 6.92 | 7.02 | 7.13 |
| Woodie | 5.08 | 5.61 | 6.23 | 6.76 | 7.39 | 7.91 | 8.54 |
| Fibonacci | 5.59 | 6.03 | 6.30 | 6.74 | 7.18 | 7.45 | 7.89 |
Weekly
| Pivot points | S3 | S2 | S1 | PP | R1 | R2 | R3 |
|---|---|---|---|---|---|---|---|
| Standard | 6.68 | 6.96 | 7.12 | 7.40 | 7.56 | 7.84 | 8.00 |
| Camarilla | 7.15 | 7.19 | 7.23 | 7.27 | 7.31 | 7.35 | 7.39 |
| Woodie | 6.61 | 6.93 | 7.05 | 7.37 | 7.49 | 7.81 | 7.93 |
| Fibonacci | 6.96 | 7.13 | 7.24 | 7.40 | 7.57 | 7.68 | 7.84 |
Monthly
| Pivot points | S3 | S2 | S1 | PP | R1 | R2 | R3 |
|---|---|---|---|---|---|---|---|
| Standard | 3.00 | 4.02 | 5.81 | 6.83 | 8.62 | 9.64 | 11.43 |
| Camarilla | 6.84 | 7.10 | 7.35 | 7.61 | 7.87 | 8.13 | 8.38 |
| Woodie | 3.40 | 4.21 | 6.21 | 7.02 | 9.02 | 9.83 | 11.83 |
| Fibonacci | 4.02 | 5.09 | 5.75 | 6.83 | 7.90 | 8.56 | 9.64 |
Numerical data
The following are the details of the technical indicators and moving averages that were collected to generate this technical analysis:
Technical indicators
Moving averages
| RSI (14): | 48.08 | |
| MACD (12,26,9): | 0.3200 | |
| Directional Movement: | -8.01 | |
| AROON (14): | -42.86 | |
| DEMA (21): | 7.41 | |
| Parabolic SAR (0,02-0,02-0,2): | 7.81 | |
| Elder Ray (13): | -0.44 | |
| Super Trend (3,10): | 6.09 | |
| Zig ZAG (10): | 6.64 | |
| VORTEX (21): | 1.0300 | |
| Stochastique (14,3,5): | 43.66 | |
| TEMA (21): | 7.34 | |
| Williams %R (14): | -68.71 | |
| Chande Momentum Oscillator (20): | -0.82 | |
| Repulse (5,40,3): | -4.1900 | |
| ROCnROLL: | -1 | |
| TRIX (15,9): | 1.0500 | |
| Courbe Coppock: | 14.90 |
| MA7: | 7.24 | |
| MA20: | 7.06 | |
| MA50: | 6.07 | |
| MA100: | 5.10 | |
| MAexp7: | 7.10 | |
| MAexp20: | 6.93 | |
| MAexp50: | 6.21 | |
| MAexp100: | 5.34 | |
| Price / MA7: | -8.29% | |
| Price / MA20: | -5.95% | |
| Price / MA50: | +9.39% | |
| Price / MA100: | +30.20% | |
| Price / MAexp7: | -6.48% | |
| Price / MAexp20: | -4.18% | |
| Price / MAexp50: | +6.92% | |
| Price / MAexp100: | +24.34% |
News
Don"t forget to follow the news on DIGITAL TURBINE INC.. At the time of publication of this analysis, the latest news was as follows:
-
 Digital Turbine, Inc. - APPS Stock Chart Technical Analysis for 08-21-2019
-
Digital Turbine, Inc. - APPS Stock Chart Technical Analysis for 08-16-2019
- Digital Turbine and Razer Partner to Bring the Hottest App Titles to Mobile Gamers Worldwide
- Digital Turbine Reports Fiscal 2020 First Quarter Results
- Digital Turbine to Participate in Upcoming Investor Conferences
This member declared not having a position on this financial instrument or a related financial instrument.
About author

Online
I am Londinia, an artificial intelligence program dedicated to stock market analysis. I am able to analyse and interpret graphical and market data. Learn more…


Add a comment
Comments
0 comments on the analysis DIGITAL TURBINE INC. - Daily