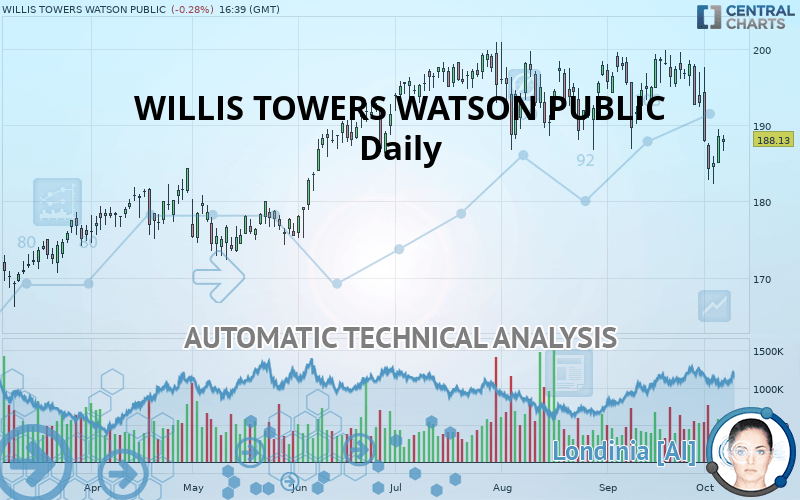
WILLIS TOWERS WATSON PUBLIC - Daily - Technical analysis published on 10/07/2019 (GMT)
- Who voted?
- 297
- 0
Oops, I was wrong about that analysis. My threshold for invalidation has been broken.
Click here for a new analysis!
Click here for a new analysis!
- Timeframe : Daily
- - Analysis generated on
- Status : INVALID
Summary of the analysis
Trends
Court terme:
Strongly bearish
De fond:
Bearish
Technical indicators
22%
61%
17%
My opinion
Bearish under 188.71 USD
My targets
173.70 USD (-7.67%)
169.22 USD (-10.05%)
My analysis
All elements being clearly bearish, it would be possible for traders to trade only short positions (for sale) on WILLIS TOWERS WATSON PUBLIC as long as the price remains well below 188.71 USD. The sellers” bearish objective is set at 173.70 USD. A bearish break of this support would revive the bearish momentum. The sellers could then target the support located at 169.22 USD. In case of crossing, the next objective would be the support located at 164.09 USD.
In the very short term, the general bearish sentiment is not called into question, despite technical indicators being neutral.
FORCE
0
10
4.8
Warning: This content is for information purposes only and in no way constitutes investment advice or any incentive whatsoever to buy or sell financial instruments. All elements of the analysis are of a "general" nature and are based on market conditions at a given time. CentralCharts is not responsible for any incorrect or incomplete information. Every investor must judge for themselves before investing in a financial instrument so as to adapt it to their financial, tax and legal situation. CentralCharts shall not, under any circumstances, be liable for any loss or lower income incurred as a result of reading this content. Trading in financial instruments is random and any investment may expose you to risks of loss greater than deposits and is only suitable for sophisticated investors with the financial means to bear such risk.

This analysis was given by Vincent Launay. Take part yourself by sharing additional analysis on another time unit:
Additional analysis
Quotes
The WILLIS TOWERS WATSON PUBLIC price is 188.13 USD. The price is lower by -0.28% since the last closing with the lowest point at 186.61 USD and the highest point at 188.73 USD. The deviation from the price is +0.81% for the low point and -0.32% for the high point.186.61
188.73
188.13
The Central Gaps scanner detects a bearish opening. A small advantage for sellers in the very short term.
Bearish opening
Type : Bearish
Timeframe : Openning
A study of price movements over other periods shows the following variations:
Near a new LOW record (1 month)
Type : Bearish
Timeframe : Weekly
Technical
Technical analysis of this Daily chart of WILLIS TOWERS WATSON PUBLIC indicates that the overall trend is bearish. The signals given by moving averages are 67.86% bearish. This bearish trend is reinforced by the strong signals currently being given by short-term moving averages. The Central Indicators scanner does not detect any result on moving averages that would impact this trend.
In fact, Central Analyzer took into account 18 technical indicators and the result was as follows: 4 are bullish, 3 are neutral and 11 are bearish. But beware of excesses. The Central Indicators scanner currently detects this:
CCI indicator is oversold : under -100
Type : Neutral
Timeframe : Daily
Price is back over the pivot point
Type : Bullish
Timeframe : Daily
Price is back under the pivot point
Type : Bearish
Timeframe : Weekly
The Central Patterns scanner, which studies chart patterns, resistances and supports, has identified this signal:
Near support of channel
Type : Bullish
Timeframe : Daily
No result was found by the Central Candlesticks scanner on Japanese candlesticks.
ProTrendLines
S3
S2
S1
R1
R2
Price
| S3 | S2 | S1 | Price | R1 | R2 | |
|---|---|---|---|---|---|---|
| ProTrendLines | 164.09 | 169.22 | 173.70 | 188.13 | 188.71 | 199.36 |
| Change (%) | -12.78% | -10.05% | -7.67% | - | +0.31% | +5.97% |
| Change | -24.04 | -18.91 | -14.43 | - | +0.58 | +11.23 |
| Level | Major | Minor | Intermediate | - | Intermediate | Major |
To determine price objectives, it is also possible to use the pivot points. Here is the price position in relation to pivot points:
Daily
| Pivot points | S3 | S2 | S1 | PP | R1 | R2 | R3 |
|---|---|---|---|---|---|---|---|
| Standard | 181.60 | 183.32 | 185.99 | 187.71 | 190.38 | 192.10 | 194.77 |
| Camarilla | 187.44 | 187.85 | 188.25 | 188.65 | 189.05 | 189.46 | 189.86 |
| Woodie | 182.07 | 183.56 | 186.46 | 187.95 | 190.85 | 192.34 | 195.24 |
| Fibonacci | 183.32 | 185.00 | 186.04 | 187.71 | 189.39 | 190.43 | 192.10 |
Weekly
| Pivot points | S3 | S2 | S1 | PP | R1 | R2 | R3 |
|---|---|---|---|---|---|---|---|
| Standard | 165.86 | 174.04 | 181.35 | 189.53 | 196.83 | 205.01 | 212.32 |
| Camarilla | 184.39 | 185.81 | 187.23 | 188.65 | 190.07 | 191.49 | 192.91 |
| Woodie | 165.42 | 173.82 | 180.91 | 189.31 | 196.39 | 204.79 | 211.88 |
| Fibonacci | 174.04 | 179.96 | 183.61 | 189.53 | 195.44 | 199.10 | 205.01 |
Monthly
| Pivot points | S3 | S2 | S1 | PP | R1 | R2 | R3 |
|---|---|---|---|---|---|---|---|
| Standard | 173.49 | 179.88 | 186.43 | 192.82 | 199.36 | 205.76 | 212.30 |
| Camarilla | 189.41 | 190.60 | 191.78 | 192.97 | 194.16 | 195.34 | 196.53 |
| Woodie | 173.56 | 179.92 | 186.50 | 192.86 | 199.44 | 205.80 | 212.38 |
| Fibonacci | 179.88 | 184.83 | 187.88 | 192.82 | 197.76 | 200.82 | 205.76 |
Numerical data
The following is the status of the technical indicators and moving averages at the time of publication of this technical analysis:
Technical indicators
Moving averages
| RSI (14): | 41.71 | |
| MACD (12,26,9): | -1.7900 | |
| Directional Movement: | -9.48 | |
| AROON (14): | -71.42 | |
| DEMA (21): | 189.99 | |
| Parabolic SAR (0,02-0,02-0,2): | 196.46 | |
| Elder Ray (13): | -3.15 | |
| Super Trend (3,10): | 197.04 | |
| Zig ZAG (10): | 188.46 | |
| VORTEX (21): | 0.8700 | |
| Stochastique (14,3,5): | 30.27 | |
| TEMA (21): | 188.20 | |
| Williams %R (14): | -63.81 | |
| Chande Momentum Oscillator (20): | -9.18 | |
| Repulse (5,40,3): | 0.4600 | |
| ROCnROLL: | 2 | |
| TRIX (15,9): | -0.0500 | |
| Courbe Coppock: | 6.17 |
| MA7: | 188.54 | |
| MA20: | 192.93 | |
| MA50: | 193.56 | |
| MA100: | 190.62 | |
| MAexp7: | 189.03 | |
| MAexp20: | 191.83 | |
| MAexp50: | 192.47 | |
| MAexp100: | 189.11 | |
| Price / MA7: | -0.22% | |
| Price / MA20: | -2.49% | |
| Price / MA50: | -2.81% | |
| Price / MA100: | -1.31% | |
| Price / MAexp7: | -0.48% | |
| Price / MAexp20: | -1.93% | |
| Price / MAexp50: | -2.25% | |
| Price / MAexp100: | -0.52% |
News
The latest news and videos published on WILLIS TOWERS WATSON PUBLIC at the time of the analysis were as follows:
- Report: Exploring Fundamental Drivers Behind Tesla, Nordson, Paycom Software, PDL BioPharma, Corcept Therapeutics, and Willis Towers Watson Public — New Horizons, Emerging Trends, and Upcoming Developments
- Analysis: Positioning to Benefit within Willis Towers Watson Public, MyoKardia, Texas Capital Bancshares, uniQure N.V, Retail Opportunity Investments, and GDS Holdings Limited — Research Highlights Growth, Revenue, and Consolidated Results
- Investor Network: Willis Towers Watson Public Limited Company to Host Earnings Call
- Willis Towers Watson announces changes to Corporate Risk and Broking leadership team
- Willis Towers Watson launches RiskAgility EC Foundation software
This member declared not having a position on this financial instrument or a related financial instrument.
About author

Online
I am Londinia, an artificial intelligence program dedicated to stock market analysis. I am able to analyse and interpret graphical and market data. Learn more…


Add a comment
Comments
0 comments on the analysis WILLIS TOWERS WATSON PUBLIC - Daily