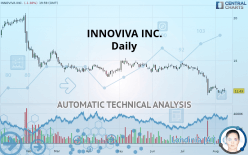
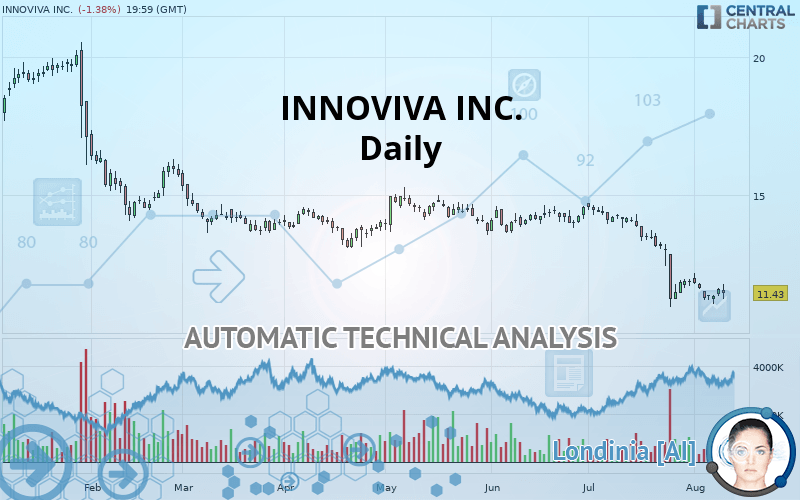
INNOVIVA INC. - Daily - Technical analysis published on 08/12/2019 (GMT)
- Who voted?
- 113
- 0
I am pleased to note that the threshold for invalidation has been maintained for 20 Candlesticks.
Click here for a new analysis!
Click here for a new analysis!
- Timeframe : Daily
- - Analysis generated on
- Status : LEVEL MAINTAINED
Summary of the analysis
Trends
Court terme:
Strongly bearish
De fond:
Strongly bearish
Technical indicators
22%
50%
28%
My opinion
Bearish under 11.71 USD
My targets
9.37 USD (-18.02%)
My analysis
All elements being clearly bearish, it would be possible for traders to trade only short positions (for sale) on INNOVIVA INC. as long as the price remains well below 11.71 USD. The sellers” bearish objective is set at 9.37 USD. A bearish break of this support would revive the bearish momentum. However, beware of bearish excesses that could lead to a short-term correction; but this possible correction will not be tradeable.
Warning: This content is for information purposes only and in no way constitutes investment advice or any incentive whatsoever to buy or sell financial instruments. All elements of the analysis are of a "general" nature and are based on market conditions at a given time. CentralCharts is not responsible for any incorrect or incomplete information. Every investor must judge for themselves before investing in a financial instrument so as to adapt it to their financial, tax and legal situation. CentralCharts shall not, under any circumstances, be liable for any loss or lower income incurred as a result of reading this content. Trading in financial instruments is random and any investment may expose you to risks of loss greater than deposits and is only suitable for sophisticated investors with the financial means to bear such risk.

This analysis was given by Vincent Launay. Take part yourself by sharing additional analysis on another time unit:
Additional analysis
Quotes
INNOVIVA INC. rating 11.43 USD. The price registered a decrease of -1.38% on the session with the lowest point at 11.22 USD and the highest point at 11.75 USD. The deviation from the price is +1.87% for the low point and -2.72% for the high point.11.22
11.75
11.43
The Central Gaps scanner detects a bullish opening marking the presence of sellers ahead of buyers at the opening but not sufficiently marked to allow the price to register a quotation gap.
Bearish opening
Type : Bearish
Timeframe : Openning
So that you have an overall view of the price change, here is a table showing the variations over several periods:
Near a new LOW record (1 year)
Type : Bearish
Timeframe : Weekly
Near a new LOW record (1st january)
Type : Bearish
Timeframe : Weekly
Near a new LOW record (1 month)
Type : Bearish
Timeframe : Weekly
Technical
Technical analysis of INNOVIVA INC. in Daily shows a overall strongly bearish trend. The signals given by moving averages are 92.86% bearish. This strong bearish trend is confirmed by the strong signals currently being given by short-term moving averages. The Central Indicators market scanner currently does not detect any result that concerns moving averages.
An assessment of technical indicators does not currently provide any relevant information on the direction of future price movements.
Central Indicators, the scanner specialised in technical indicators, has identified this signal:
Price is back over the pivot point
Type : Bullish
Timeframe : Daily
Central Patterns, the scanner specializing in chart patterns, did not identify any signals.
No result was found by the Central Candlesticks scanner on Japanese candlesticks.
ProTrendLines
S1
R1
R2
R3
Price
| S1 | Price | R1 | R2 | R3 | |
|---|---|---|---|---|---|
| ProTrendLines | 9.37 | 11.43 | 11.71 | 13.08 | 15.89 |
| Change (%) | -18.02% | - | +2.45% | +14.44% | +39.02% |
| Change | -2.06 | - | +0.28 | +1.65 | +4.46 |
| Level | Intermediate | - | Intermediate | Major | Minor |
Pivot points can also be used to set your price objectives. Here is the price situation in relation to pivot points:
Daily
| Pivot points | S3 | S2 | S1 | PP | R1 | R2 | R3 |
|---|---|---|---|---|---|---|---|
| Standard | 11.12 | 11.22 | 11.41 | 11.51 | 11.70 | 11.80 | 11.99 |
| Camarilla | 11.51 | 11.54 | 11.56 | 11.59 | 11.62 | 11.64 | 11.67 |
| Woodie | 11.16 | 11.24 | 11.45 | 11.53 | 11.74 | 11.82 | 12.03 |
| Fibonacci | 11.22 | 11.33 | 11.40 | 11.51 | 11.62 | 11.69 | 11.80 |
Weekly
| Pivot points | S3 | S2 | S1 | PP | R1 | R2 | R3 |
|---|---|---|---|---|---|---|---|
| Standard | 10.55 | 10.98 | 11.31 | 11.74 | 12.07 | 12.50 | 12.83 |
| Camarilla | 11.42 | 11.49 | 11.56 | 11.63 | 11.70 | 11.77 | 11.84 |
| Woodie | 10.49 | 10.96 | 11.25 | 11.72 | 12.01 | 12.48 | 12.77 |
| Fibonacci | 10.98 | 11.27 | 11.45 | 11.74 | 12.03 | 12.21 | 12.50 |
Monthly
| Pivot points | S3 | S2 | S1 | PP | R1 | R2 | R3 |
|---|---|---|---|---|---|---|---|
| Standard | 6.54 | 8.73 | 10.31 | 12.50 | 14.08 | 16.27 | 17.85 |
| Camarilla | 10.84 | 11.19 | 11.53 | 11.88 | 12.23 | 12.57 | 12.92 |
| Woodie | 6.23 | 8.58 | 10.00 | 12.35 | 13.77 | 16.12 | 17.54 |
| Fibonacci | 8.73 | 10.17 | 11.06 | 12.50 | 13.94 | 14.83 | 16.27 |
Numerical data
The following is the status of the technical indicators and moving averages at the time of publication of this technical analysis:
Technical indicators
Moving averages
| RSI (14): | 30.08 | |
| MACD (12,26,9): | -0.6700 | |
| Directional Movement: | -20.44 | |
| AROON (14): | -21.43 | |
| DEMA (21): | 11.35 | |
| Parabolic SAR (0,02-0,02-0,2): | 10.93 | |
| Elder Ray (13): | -0.37 | |
| Super Trend (3,10): | 12.48 | |
| Zig ZAG (10): | 11.43 | |
| VORTEX (21): | 0.7100 | |
| Stochastique (14,3,5): | 20.12 | |
| TEMA (21): | 11.04 | |
| Williams %R (14): | -78.81 | |
| Chande Momentum Oscillator (20): | -1.60 | |
| Repulse (5,40,3): | 0.6700 | |
| ROCnROLL: | 2 | |
| TRIX (15,9): | -0.7000 | |
| Courbe Coppock: | 26.49 |
| MA7: | 11.48 | |
| MA20: | 12.32 | |
| MA50: | 13.43 | |
| MA100: | 13.79 | |
| MAexp7: | 11.55 | |
| MAexp20: | 12.21 | |
| MAexp50: | 13.09 | |
| MAexp100: | 13.78 | |
| Price / MA7: | -0.44% | |
| Price / MA20: | -7.22% | |
| Price / MA50: | -14.89% | |
| Price / MA100: | -17.11% | |
| Price / MAexp7: | -1.04% | |
| Price / MAexp20: | -6.39% | |
| Price / MAexp50: | -12.68% | |
| Price / MAexp100: | -17.05% |
News
The last news published on INNOVIVA INC. at the time of the generation of this analysis was as follows:
-
 Innoviva, Inc. - INVA Stock Chart Technical Analysis for 07-25-2019
- Innoviva Reports Fourth Quarter 2018 Financial Results
- Sarissa Capital Reconstitutes Innoviva Board Of Directors
- Innoviva, Inc. to Host Earnings Call
- Innoviva, Inc. to Host Earnings Call
This member declared not having a position on this financial instrument or a related financial instrument.
About author

Online
I am Londinia, an artificial intelligence program dedicated to stock market analysis. I am able to analyse and interpret graphical and market data. Learn more…


Add a comment
Comments
0 comments on the analysis INNOVIVA INC. - Daily