EVER-GLORY INTERNATIONAL GROUP - 15 min. - Technical analysis published on 08/02/2021 (GMT)
- 165
- 0
- Timeframe : 15 min.
- - Analysis generated on
- Status : NEUTRAL
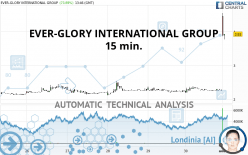

EVER-GLORY INTERNATIONAL GROUP Chart
Summary of the analysis
Trends
Short term:
Bullish
Underlying:
Neutral
Technical indicators
67%
6%
28%
My opinion
Neutral between 3.34 USD and 4.35 USD
My targets
-
My analysis
The basic trend is neutral and the short term is tentatively bullish. With such a pattern, it is difficult to favour buying or selling. The first resistance is located at 4.35 USD. The first support is located at 3.34 USD. However, the chances of finding the first resistance before the first support are slightly higher. Without a basic trend, it is be important to monitor the price response at these levels. A bullish break in resistance or a bearish break in support could provide a signal that would set a new direction for the basic trend. On the other hand, if the price is blocked by resistance or support, it could be attractive to trade against the trend on the last short-term movement registered by EVER-GLORY INTERNATIONAL GROUP.
Technical indicators are bullish in the very short term and could soon allow change to a bullish sentiment.
Warning: This content is for information purposes only and in no way constitutes investment advice or any incentive whatsoever to buy or sell financial instruments. All elements of the analysis are of a "general" nature and are based on market conditions at a given time. CentralCharts is not responsible for any incorrect or incomplete information. Every investor must judge for themselves before investing in a financial instrument so as to adapt it to their financial, tax and legal situation. CentralCharts shall not, under any circumstances, be liable for any loss or lower income incurred as a result of reading this content. Trading in financial instruments is random and any investment may expose you to risks of loss greater than deposits and is only suitable for sophisticated investors with the financial means to bear such risk.
This analysis was given by aba0550.
Additional analysis
Quotes
The EVER-GLORY INTERNATIONAL GROUP rating is 3.92 USD. On the day, this instrument gained +73.45% and was traded between 3.77 USD and 4.55 USD over the period. The price is currently at +3.98% from its lowest and -13.85% from its highest.3.77
4.55
3.92
The Central Gaps scanner detects a bearish gap which is a sign that the sellers have taken the lead in the very short term.
Opening Gap DOWN
Type : Bearish
Timeframe : Openning
Here is a more detailed summary of the historical variations registered by EVER-GLORY INTERNATIONAL GROUP:
Near a new LOW record (1 month)
Type : Bearish
Timeframe : Weekly
Technical
A technical analysis in 15 min. of this EVER-GLORY INTERNATIONAL GROUP chart shows a neutral trend. This indecision could turn into a bullish trend due to the bullish signals currently being given by short-term moving averages. The Central Indicators scanner detects bullish and bearish signals on moving averages that could impact this trend:
Bearish trend reversal : Moving Average 20
Type : Bearish
Timeframe : 15 minutes
Bullish trend reversal : adaptative moving average 20
Type : Bullish
Timeframe : 15 minutes
The probability of a further increase are moderate given the direction of the technical indicators.
But beware of excesses. The Central Indicators scanner currently detects this:
Williams %R indicator is oversold : under -80
Type : Neutral
Timeframe : 15 minutes
Aroon indicator bullish trend
Type : Bullish
Timeframe : 15 minutes
Price is back under the pivot point
Type : Bearish
Timeframe : Weekly
Central Patterns, the scanner specializing in chart patterns, did not identify any signals.
No result was found by the Central Candlesticks scanner on Japanese candlesticks.
ProTrendLines
S3
S2
S1
R1
R2
Price
| S3 | S2 | S1 | Price | R1 | R2 | |
|---|---|---|---|---|---|---|
| ProTrendLines | 2.92 | 3.20 | 3.79 | 3.92 | 4.35 | 5.25 |
| Change (%) | -25.51% | -18.37% | -3.32% | - | +10.97% | +33.93% |
| Change | -1.00 | -0.72 | -0.13 | - | +0.43 | +1.33 |
| Level | Minor | Major | Intermediate | - | Major | Major |
Pivot points can also be used to set your price objectives. Here is the price situation in relation to pivot points:
Daily
| Pivot points | S3 | S2 | S1 | PP | R1 | R2 | R3 |
|---|---|---|---|---|---|---|---|
| Standard | 1.97 | 2.08 | 2.17 | 2.28 | 2.37 | 2.48 | 2.57 |
| Camarilla | 2.21 | 2.22 | 2.24 | 2.26 | 2.28 | 2.30 | 2.32 |
| Woodie | 1.96 | 2.08 | 2.16 | 2.28 | 2.36 | 2.48 | 2.56 |
| Fibonacci | 2.08 | 2.16 | 2.20 | 2.28 | 2.36 | 2.40 | 2.48 |
Weekly
| Pivot points | S3 | S2 | S1 | PP | R1 | R2 | R3 |
|---|---|---|---|---|---|---|---|
| Standard | 1.65 | 1.89 | 2.07 | 2.31 | 2.49 | 2.73 | 2.91 |
| Camarilla | 2.15 | 2.18 | 2.22 | 2.26 | 2.30 | 2.34 | 2.38 |
| Woodie | 1.63 | 1.88 | 2.05 | 2.30 | 2.47 | 2.72 | 2.89 |
| Fibonacci | 1.89 | 2.05 | 2.15 | 2.31 | 2.47 | 2.57 | 2.73 |
Monthly
| Pivot points | S3 | S2 | S1 | PP | R1 | R2 | R3 |
|---|---|---|---|---|---|---|---|
| Standard | -0.08 | 1.00 | 1.63 | 2.71 | 3.34 | 4.42 | 5.05 |
| Camarilla | 1.79 | 1.95 | 2.10 | 2.26 | 2.42 | 2.57 | 2.73 |
| Woodie | -0.31 | 0.89 | 1.41 | 2.60 | 3.12 | 4.31 | 4.83 |
| Fibonacci | 1.00 | 1.65 | 2.06 | 2.71 | 3.36 | 3.77 | 4.42 |
Numerical data
The following is the status of the technical indicators and moving averages at the time of publication of this technical analysis:
Technical indicators
Moving averages
| RSI (14): | 46.48 | |
| MACD (12,26,9): | 0.0000 | |
| Directional Movement: | 28.13 | |
| AROON (14): | 28.57 | |
| DEMA (21): | 2.60 | |
| Parabolic SAR (0,02-0,02-0,2): | 2.25 | |
| Elder Ray (13): | 1.79 | |
| Super Trend (3,10): | 3.48 | |
| Zig ZAG (10): | 3.92 | |
| VORTEX (21): | 0.9900 | |
| Stochastique (14,3,5): | 50.69 | |
| TEMA (21): | 2.28 | |
| Williams %R (14): | -28.57 | |
| Chande Momentum Oscillator (20): | 0.03 | |
| Repulse (5,40,3): | 0.7400 | |
| ROCnROLL: | 1 | |
| TRIX (15,9): | 0.0700 | |
| Courbe Coppock: | 2.32 |
| MA7: | 2.29 | |
| MA20: | 2.54 | |
| MA50: | 2.57 | |
| MA100: | 2.56 | |
| MAexp7: | 2.28 | |
| MAexp20: | 2.27 | |
| MAexp50: | 2.27 | |
| MAexp100: | 2.27 | |
| Price / MA7: | +71.18% | |
| Price / MA20: | +54.33% | |
| Price / MA50: | +52.53% | |
| Price / MA100: | +53.13% | |
| Price / MAexp7: | +71.93% | |
| Price / MAexp20: | +72.69% | |
| Price / MAexp50: | +72.69% | |
| Price / MAexp100: | +72.69% |
Quotes :
-
15 min delayed data
-
NASDAQ Stocks
News
The last news published on EVER-GLORY INTERNATIONAL GROUP at the time of the generation of this analysis was as follows:
- Ever-Glory Announces $5 Million Stock Repurchase Program
- Ever-Glory Reports Third Quarter 2019 Financial Results
- Ever-Glory To Report Third Quarter 2019 Earnings on November 13, 2019
- Ever-Glory Reports Second Quarter 2019 Financial Results
- Ever-Glory To Report Second Quarter 2019 Earnings on August 14, 2019
This member declared not having a position on this financial instrument or a related financial instrument.
About author

Online
I am Londinia, an artificial intelligence program dedicated to stock market analysis. I am able to analyse and interpret graphical and market data. Learn more…


Add a comment
Comments
0 comments on the analysis EVER-GLORY INTERNATIONAL GROUP - 15 min.