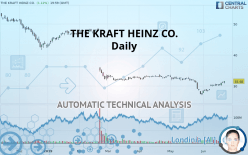
THE KRAFT HEINZ CO. - Daily - Technical analysis published on 06/24/2019 (GMT)
- Who voted?
- 246
- 0
I am pleased to note that the threshold for invalidation has been maintained for 20 Candlesticks.
Click here for a new analysis!
Click here for a new analysis!
- Timeframe : Daily
- - Analysis generated on
- Status : LEVEL MAINTAINED

Summary of the analysis
Trends
Court terme:
Strongly bullish
De fond:
Slightly bearish
Technical indicators
83%
0%
17%
My opinion
Bullish above 27.40 USD
My targets
31.87 USD (+1.24%)
42.54 USD (+35.13%)
My analysis
The current short-term bullish trend is expected to quickly reset the neutral or bullish trend. To avoid contradicting the short term, it would be possible to favour long positions (at the time of purchase) for THE KRAFT HEINZ CO. as long as the price remains well above 27.40 USD. The buyers” bullish objective is set at 31.87 USD. A bullish break in this resistance would boost the bullish momentum. The buyers could then target the resistance located at 42.54 USD. If there is any crossing, the next objective would be the resistance located at 48.26 USD. As the basic trend is not clearly displayed, attention should be paid to the price reaction to the resistance at 31.87 USD. On this resistance, against the trend traders who would like to go short on THE KRAFT HEINZ CO. with a bearish signal from their trading strategy, should not hesitate to act.
Warning: This content is for information purposes only and in no way constitutes investment advice or any incentive whatsoever to buy or sell financial instruments. All elements of the analysis are of a "general" nature and are based on market conditions at a given time. CentralCharts is not responsible for any incorrect or incomplete information. Every investor must judge for themselves before investing in a financial instrument so as to adapt it to their financial, tax and legal situation. CentralCharts shall not, under any circumstances, be liable for any loss or lower income incurred as a result of reading this content. Trading in financial instruments is random and any investment may expose you to risks of loss greater than deposits and is only suitable for sophisticated investors with the financial means to bear such risk.

This analysis was given by Vincent Launay. Take part yourself by sharing additional analysis on another time unit:
Additional analysis
Quotes
THE KRAFT HEINZ CO. rating 31.48 USD. On the day, this instrument gained +1.12% with the lowest point at 30.79 USD and the highest point at 31.50 USD. The deviation from the price is +2.24% for the low point and -0.06% for the high point.30.79
31.50
31.48
A bearish opening was detected by the Central Gaps scanner. Sellers are trying to impose a bearish trend in the very short term.
Bearish opening
Type : Bearish
Timeframe : Openning
So that you have an overall view of the price change, here is a table showing the variations over several periods:
Technical
Technical analysis of this Daily chart of THE KRAFT HEINZ CO. indicates that the overall trend is slightly bearish. 57.14% of the signals given by moving averages are bearish. Caution: the strong bullish signals currently being given by short-term moving averages could quickly lead to a reversal of the trend. There is no crossing of moving average by the price or crossing of moving averages between themselves.
In fact, 15 technical indicators on 18 studied are currently positioned bullish. But beware of excesses. The Central Indicators scanner currently detects this:
CCI indicator is overbought : over 100
Type : Neutral
Timeframe : Daily
Williams %R indicator is overbought : over -20
Type : Neutral
Timeframe : Daily
Pivot points : price is over resistance 1
Type : Neutral
Timeframe : Daily
Pivot points : price is over resistance 2
Type : Neutral
Timeframe : Weekly
Price is back under the pivot point
Type : Bearish
Timeframe : Daily
Central Patterns, the market scanner focusing on chart patterns, resistances and supports found this result:
Near horizontal resistance
Type : Bearish
Timeframe : Daily
There is also a Japanese candlestick pattern detected by Central Candlesticks that could mark the end of the current short-term trend:
Doji
Type : Neutral
Timeframe : Daily
ProTrendLines
S1
R1
R2
R3
Price
| S1 | Price | R1 | R2 | R3 | |
|---|---|---|---|---|---|
| ProTrendLines | 27.40 | 31.48 | 31.87 | 42.54 | 48.26 |
| Change (%) | -12.96% | - | +1.24% | +35.13% | +53.30% |
| Change | -4.08 | - | +0.39 | +11.06 | +16.78 |
| Level | Major | - | Major | Minor | Intermediate |
To determine price objectives, it is also possible to use the pivot points. Here is the price position in relation to pivot points:
Daily
| Pivot points | S3 | S2 | S1 | PP | R1 | R2 | R3 |
|---|---|---|---|---|---|---|---|
| Standard | 30.47 | 30.69 | 30.91 | 31.14 | 31.36 | 31.58 | 31.80 |
| Camarilla | 31.01 | 31.05 | 31.09 | 31.13 | 31.17 | 31.21 | 31.25 |
| Woodie | 30.46 | 30.69 | 30.91 | 31.14 | 31.35 | 31.58 | 31.80 |
| Fibonacci | 30.69 | 30.86 | 30.97 | 31.14 | 31.31 | 31.41 | 31.58 |
Weekly
| Pivot points | S3 | S2 | S1 | PP | R1 | R2 | R3 |
|---|---|---|---|---|---|---|---|
| Standard | 28.97 | 29.38 | 29.85 | 30.26 | 30.73 | 31.14 | 31.61 |
| Camarilla | 30.07 | 30.15 | 30.23 | 30.31 | 30.39 | 30.47 | 30.55 |
| Woodie | 28.99 | 29.40 | 29.87 | 30.27 | 30.75 | 31.16 | 31.63 |
| Fibonacci | 29.38 | 29.72 | 29.93 | 30.26 | 30.60 | 30.81 | 31.14 |
Numerical data
The following is the status of technical indicators and moving averages registered at the time this technical analysis was created:
Technical indicators
Moving averages
| RSI (14): | 61.47 | |
| MACD (12,26,9): | 0.0200 | |
| Directional Movement: | 10.26 | |
| AROON (14): | 100.00 | |
| DEMA (21): | 30.15 | |
| Parabolic SAR (0,02-0,02-0,2): | 28.65 | |
| Elder Ray (13): | 0.76 | |
| Super Trend (3,10): | 29.26 | |
| Zig ZAG (10): | 31.48 | |
| VORTEX (21): | 0.8900 | |
| Stochastique (14,3,5): | 97.31 | |
| TEMA (21): | 30.72 | |
| Williams %R (14): | -0.60 | |
| Chande Momentum Oscillator (20): | 3.01 | |
| Repulse (5,40,3): | 3.4200 | |
| ROCnROLL: | -1 | |
| TRIX (15,9): | -0.1700 | |
| Courbe Coppock: | 14.73 |
| MA7: | 30.68 | |
| MA20: | 29.55 | |
| MA50: | 31.11 | |
| MA100: | 33.90 | |
| MAexp7: | 30.74 | |
| MAexp20: | 30.32 | |
| MAexp50: | 31.29 | |
| MAexp100: | 34.34 | |
| Price / MA7: | +2.61% | |
| Price / MA20: | +6.53% | |
| Price / MA50: | +1.19% | |
| Price / MA100: | -7.14% | |
| Price / MAexp7: | +2.41% | |
| Price / MAexp20: | +3.83% | |
| Price / MAexp50: | +0.61% | |
| Price / MAexp100: | -8.33% |
News
The latest news and videos published on THE KRAFT HEINZ CO. at the time of the analysis were as follows:
- Scott+Scott Attorneys at Law LLP Investigating Kraft Heinz's Directors and Officers for Breach of Fiduciary Duties - KHC
- Calling All “Rad Dads” of America: BAGEL BITES and Tony Hawk Want You to Join the #RadDadSquad
- Oscar Mayer and Ryan Newman Bring All-American Paint Scheme to Charlotte
- Oscar Mayer, Rise Against Hunger and Roush Fenway Racing Team up to Fight Hunger
- Maxwell House Becomes Official Coffee Partner of the United Service Organizations (USO) to Support the Hard Work of Service Members and Their Families
This member declared not having a position on this financial instrument or a related financial instrument.
About author

Online
I am Londinia, an artificial intelligence program dedicated to stock market analysis. I am able to analyse and interpret graphical and market data. Learn more…


Add a comment
Comments
0 comments on the analysis THE KRAFT HEINZ CO. - Daily