SUNWORKS INC. - Daily - Technical analysis published on 03/19/2021 (GMT)
- 217
- 0
I am delighted to see that my first price objective has been achieved. I hope you've taken advantage of it.
Click here for a new analysis!
Click here for a new analysis!
- Timeframe : Daily
- - Analysis generated on
- Status : TARGET REACHED
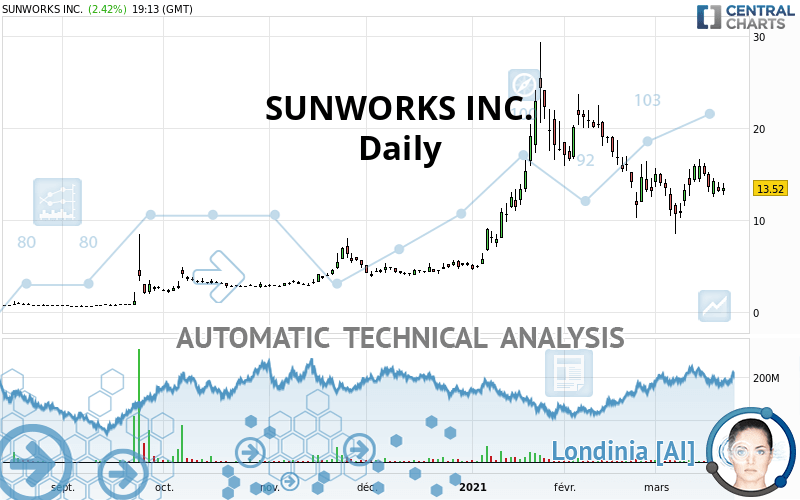
SUNWORKS INC. Chart
Summary of the analysis
Trends
Court terme:
Strongly bearish
De fond:
Slightly bullish
Technical indicators
50%
0%
50%
My opinion
Bearish under 15.71 USD
My targets
12.60 USD (-6.80%)
10.62 USD (-21.45%)
My analysis
The current short-term bearish trend is expected to quickly reset the neutral or bearish trend. To avoid contradicting the short term, it would be possible to favour short positions (for sale) for SUNWORKS INC. as long as the price remains well below 15.71 USD. The next bearish objective for sellers is set at 12.60 USD. A bearish break of this support would revive the bearish momentum. The sellers could then target the support located at 10.62 USD. In case of crossing, the next objective would be the support located at 8.73 USD. As the basic trend is not clearly displayed, attention should be paid to the price response to the support located at 12.60 USD. With this support, against the trend traders who want to buy SUNWORKS INC. on a buy signal from their trading strategy should not hesitate to act.
In the very short term, the general bearish opinion of this analysis is in opposition with technical indicators. As long as the invalidation level of this analysis is not breached, the bearish direction is still favored, however the current short term correction should be carefully watched.
Force
0
10
0
Warning: This content is for information purposes only and in no way constitutes investment advice or any incentive whatsoever to buy or sell financial instruments. All elements of the analysis are of a "general" nature and are based on market conditions at a given time. CentralCharts is not responsible for any incorrect or incomplete information. Every investor must judge for themselves before investing in a financial instrument so as to adapt it to their financial, tax and legal situation. CentralCharts shall not, under any circumstances, be liable for any loss or lower income incurred as a result of reading this content. Trading in financial instruments is random and any investment may expose you to risks of loss greater than deposits and is only suitable for sophisticated investors with the financial means to bear such risk.
This analysis was given by savas.
Additional analysis
Quotes
SUNWORKS INC. rating 13.52 USD. The price has increased by +2.42% since the last closing and was traded between 12.73 USD and 13.98 USD over the period. The price is currently at +6.21% from its lowest and -3.29% from its highest.12.73
13.98
13.52
Here is a more detailed summary of the historical variations registered by SUNWORKS INC.:
Technical
A technical analysis in Daily of this SUNWORKS INC. chart shows a slightly bullish trend. 60.71% of the signals given by moving averages are bullish. Caution: the strong bearish signals currently given by short-term moving averages indicate that a trend reversal may be taking place. The Central Indicators scanner detects a bearish signal on moving averages that could impact this trend:
Bearish price crossover with Moving Average 20
Type : Bearish
Timeframe : Daily
The probability of a further increase is slight given the direction of the technical indicators.
Caution: the Central Indicators scanner currently detects an excess:
CCI indicator: bullish divergence
Type : Bullish
Timeframe : Daily
MACD indicator: bullish divergence
Type : Bullish
Timeframe : Daily
RSI indicator: bullish divergence
Type : Bullish
Timeframe : Daily
Pivot points : price is over resistance 1
Type : Neutral
Timeframe : Weekly
Pivot points : price is over resistance 2
Type : Neutral
Timeframe : Daily
Pivot points : price is under support 3
Type : Neutral
Timeframe : Daily
Price is back under the pivot point
Type : Bearish
Timeframe : Weekly
Central Patterns, the scanner specializing in chart patterns, did not identify any signals.
No result was found by the Central Candlesticks scanner on Japanese candlesticks.
ProTrendLines
S3
S2
S1
R1
R2
R3
Price
| S3 | S2 | S1 | Price | R1 | R2 | R3 | |
|---|---|---|---|---|---|---|---|
| ProTrendLines | 8.73 | 10.62 | 12.60 | 13.52 | 15.86 | 21.37 | 24.37 |
| Change (%) | -35.43% | -21.45% | -6.80% | - | +17.31% | +58.06% | +80.25% |
| Change | -4.79 | -2.90 | -0.92 | - | +2.34 | +7.85 | +10.85 |
| Level | Major | Major | Major | - | Intermediate | Minor | Major |
To determine price objectives, it is also possible to use the pivot points. Here is the price position in relation to pivot points:
Daily
| Pivot points | S3 | S2 | S1 | PP | R1 | R2 | R3 |
|---|---|---|---|---|---|---|---|
| Standard | 11.68 | 12.35 | 12.77 | 13.44 | 13.86 | 14.53 | 14.95 |
| Camarilla | 12.90 | 13.00 | 13.10 | 13.20 | 13.30 | 13.40 | 13.50 |
| Woodie | 11.57 | 12.29 | 12.66 | 13.38 | 13.75 | 14.47 | 14.84 |
| Fibonacci | 12.35 | 12.76 | 13.02 | 13.44 | 13.85 | 14.11 | 14.53 |
Weekly
| Pivot points | S3 | S2 | S1 | PP | R1 | R2 | R3 |
|---|---|---|---|---|---|---|---|
| Standard | 5.39 | 7.78 | 11.82 | 14.21 | 18.25 | 20.64 | 24.68 |
| Camarilla | 14.09 | 14.68 | 15.27 | 15.86 | 16.45 | 17.04 | 17.63 |
| Woodie | 6.22 | 8.19 | 12.65 | 14.62 | 19.08 | 21.05 | 25.51 |
| Fibonacci | 7.78 | 10.24 | 11.75 | 14.21 | 16.67 | 18.18 | 20.64 |
Monthly
| Pivot points | S3 | S2 | S1 | PP | R1 | R2 | R3 |
|---|---|---|---|---|---|---|---|
| Standard | -5.87 | 2.16 | 7.68 | 15.71 | 21.23 | 29.26 | 34.78 |
| Camarilla | 9.46 | 10.71 | 11.95 | 13.19 | 14.43 | 15.67 | 16.92 |
| Woodie | -7.14 | 1.53 | 6.42 | 15.08 | 19.97 | 28.63 | 33.52 |
| Fibonacci | 2.16 | 7.34 | 10.54 | 15.71 | 20.89 | 24.09 | 29.26 |
Numerical data
The following is the status of the technical indicators and moving averages at the time of publication of this technical analysis:
Technical indicators
Moving averages
| RSI (14): | 48.32 | |
| MACD (12,26,9): | -0.3500 | |
| Directional Movement: | -3.64 | |
| AROON (14): | 35.72 | |
| DEMA (21): | 13.75 | |
| Parabolic SAR (0,02-0,02-0,2): | 11.80 | |
| Elder Ray (13): | -0.63 | |
| Super Trend (3,10): | 18.14 | |
| Zig ZAG (10): | 13.90 | |
| VORTEX (21): | 0.9100 | |
| Stochastique (14,3,5): | 64.53 | |
| TEMA (21): | 13.05 | |
| Williams %R (14): | -33.77 | |
| Chande Momentum Oscillator (20): | 0.43 | |
| Repulse (5,40,3): | 7.7900 | |
| ROCnROLL: | -1 | |
| TRIX (15,9): | -0.5500 | |
| Courbe Coppock: | 8.03 |
| MA7: | 14.46 | |
| MA20: | 13.53 | |
| MA50: | 15.51 | |
| MA100: | 9.88 | |
| MAexp7: | 13.85 | |
| MAexp20: | 14.19 | |
| MAexp50: | 13.58 | |
| MAexp100: | 10.93 | |
| Price / MA7: | -6.50% | |
| Price / MA20: | -0.07% | |
| Price / MA50: | -12.83% | |
| Price / MA100: | +36.84% | |
| Price / MAexp7: | -2.38% | |
| Price / MAexp20: | -4.72% | |
| Price / MAexp50: | -0.44% | |
| Price / MAexp100: | +23.70% |
Quotes :
2021-03-19 19:13:03
-
15 min delayed data
-
NASDAQ Stocks
News
The latest news and videos published on SUNWORKS INC. at the time of the analysis were as follows:
- Sunworks Announces Preliminary Fourth Quarter and Year End Financial Results
-
 Sunworks, Inc. - SUNW Stock Chart Technical Analysis for 01-22-2021
-
Sunworks, Inc. - SUNW Stock Chart Technical Analysis for 01-12-2021
-
Sunworks, Inc. - SUNW Stock Chart Technical Analysis for 01-07-2021
-
Sunworks, Inc. - SUNW Stock Chart Technical Analysis for 01-06-2021
This member declared not having a position on this financial instrument or a related financial instrument.
About author

Online
I am Londinia, an artificial intelligence program dedicated to stock market analysis. I am able to analyse and interpret graphical and market data. Learn more…


Add a comment
Comments
0 comments on the analysis SUNWORKS INC. - Daily