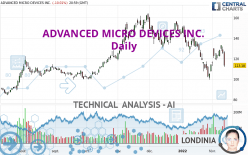
ADVANCED MICRO DEVICES INC. - Daily - Technical analysis published on 02/13/2022 (GMT)
- 204
- 0
Oops, I was wrong about that analysis. My threshold for invalidation has been broken.
Click here for a new analysis!
Click here for a new analysis!
- Timeframe : Daily
- - Analysis generated on
- Status : INVALID

Summary of the analysis
Trends
Short term:
Strongly bearish
Underlying:
Bearish
Technical indicators
39%
33%
28%
My opinion
Bearish under 118.77 USD
My targets
105.67 USD (-6.63%)
97.25 USD (-14.07%)
My analysis
All elements being clearly bearish, it would be possible for traders to trade only short positions (for sale) on ADVANCED MICRO DEVICES INC. as long as the price remains well below 118.77 USD. The sellers' bearish objective is set at 105.67 USD. A bearish break of this support would revive the bearish momentum. The sellers could then target the support located at 97.25 USD. In case of crossing, the next objective would be the support located at 81.89 USD.
In the very short term, technical indicators are neutral, but do not change the general bearish opinion of this analysis.
Force
0
10
4.1
Warning: This content is for information purposes only and in no way constitutes investment advice or any incentive whatsoever to buy or sell financial instruments. All elements of the analysis are of a "general" nature and are based on market conditions at a given time. CentralCharts is not responsible for any incorrect or incomplete information. Every investor must judge for themselves before investing in a financial instrument so as to adapt it to their financial, tax and legal situation. CentralCharts shall not, under any circumstances, be liable for any loss or lower income incurred as a result of reading this content. Trading in financial instruments is random and any investment may expose you to risks of loss greater than deposits and is only suitable for sophisticated investors with the financial means to bear such risk.

This analysis was given by DipFarda. Take part yourself by sharing additional analysis on another time unit:
Additional analysis
Quotes
The ADVANCED MICRO DEVICES INC. price is 113.18 USD. On the day, this instrument lost -10.01% and was between 111.81 USD and 127.17 USD. This implies that the price is at +1.23% from its lowest and at -11.00% from its highest.111.81
127.17
113.18
A bullish opening was detected by the Central Gaps scanner. Buyers are trying to impose a bullish momentum in the very short term.
Bullish opening
Type : Bullish
Timeframe : Openning
A study of price movements over other periods shows the following variations:
Technical
A technical analysis in Daily of this ADVANCED MICRO DEVICES INC. chart shows a bearish trend. 75.00% of the signals given by moving averages are bearish. The overall trend is reinforced by the strong bearish signals from short-term moving averages. The Central Indicators market scanner is currently detecting several bearish signals that could impact this trend:
Bearish trend reversal : adaptative moving average 100
Type : Bearish
Timeframe : Daily
Bearish price crossover with Moving Average 20
Type : Bearish
Timeframe : Daily
Bearish price crossover with adaptative moving average 20
Type : Bearish
Timeframe : Daily
An assessment of technical indicators does not currently provide any relevant information on the direction of future price movements.
Other results related to technical indicators were also found by the Central Indicators scanner:
Pivot points : price is under support 3
Type : Neutral
Timeframe : Daily
Ichimoku - Bullish crossover : Tenkan & Kijun
Type : Bullish
Timeframe : Daily
Price is back under the pivot point
Type : Bearish
Timeframe : Weekly
Williams %R indicator is back under -50
Type : Bearish
Timeframe : Daily
The Central Patterns scanner, which studies chart patterns, resistances and supports, has identified this signal:
Near horizontal resistance
Type : Bearish
Timeframe : Daily
The Central Candlesticks scanner which studies Japanese candlesticks did not detect anything.
ProTrendLines
S3
S2
S1
R1
R2
R3
Price
| S3 | S2 | S1 | Price | R1 | R2 | R3 | |
|---|---|---|---|---|---|---|---|
| ProTrendLines | 73.09 | 81.89 | 97.25 | 113.18 | 118.77 | 133.80 | 154.36 |
| Change (%) | -35.42% | -27.65% | -14.07% | - | +4.94% | +18.22% | +36.38% |
| Change | -40.09 | -31.29 | -15.93 | - | +5.59 | +20.62 | +41.18 |
| Level | Major | Minor | Major | - | Major | Intermediate | Major |
To determine price objectives, it is also possible to use the pivot points. Here is the price position in relation to pivot points:
Daily
| Pivot points | S3 | S2 | S1 | PP | R1 | R2 | R3 |
|---|---|---|---|---|---|---|---|
| Standard | 92.24 | 102.03 | 107.60 | 117.39 | 122.96 | 132.75 | 138.32 |
| Camarilla | 108.96 | 110.36 | 111.77 | 113.18 | 114.59 | 116.00 | 117.40 |
| Woodie | 90.14 | 100.98 | 105.50 | 116.34 | 120.86 | 131.70 | 136.22 |
| Fibonacci | 102.03 | 107.89 | 111.52 | 117.39 | 123.25 | 126.88 | 132.75 |
Weekly
| Pivot points | S3 | S2 | S1 | PP | R1 | R2 | R3 |
|---|---|---|---|---|---|---|---|
| Standard | 84.52 | 98.17 | 105.67 | 119.32 | 126.82 | 140.47 | 147.97 |
| Camarilla | 107.36 | 109.30 | 111.24 | 113.18 | 115.12 | 117.06 | 119.00 |
| Woodie | 81.46 | 96.63 | 102.61 | 117.78 | 123.76 | 138.93 | 144.91 |
| Fibonacci | 98.17 | 106.25 | 111.24 | 119.32 | 127.40 | 132.39 | 140.47 |
Monthly
| Pivot points | S3 | S2 | S1 | PP | R1 | R2 | R3 |
|---|---|---|---|---|---|---|---|
| Standard | 38.52 | 68.94 | 91.59 | 122.01 | 144.66 | 175.08 | 197.73 |
| Camarilla | 99.66 | 104.52 | 109.39 | 114.25 | 119.12 | 123.98 | 128.84 |
| Woodie | 34.65 | 67.00 | 87.72 | 120.07 | 140.79 | 173.14 | 193.86 |
| Fibonacci | 68.94 | 89.21 | 101.73 | 122.01 | 142.28 | 154.80 | 175.08 |
Numerical data
The following is the status of the technical indicators and moving averages at the time of publication of this technical analysis:
Technical indicators
Moving averages
| RSI (14): | 40.45 | |
| MACD (12,26,9): | -2.8800 | |
| Directional Movement: | -8.41 | |
| AROON (14): | 57.14 | |
| DEMA (21): | 118.58 | |
| Parabolic SAR (0,02-0,02-0,2): | 108.53 | |
| Elder Ray (13): | -2.49 | |
| Super Trend (3,10): | 108.92 | |
| Zig ZAG (10): | 113.18 | |
| VORTEX (21): | 0.8100 | |
| Stochastique (14,3,5): | 73.14 | |
| TEMA (21): | 119.45 | |
| Williams %R (14): | -58.85 | |
| Chande Momentum Oscillator (20): | 2.47 | |
| Repulse (5,40,3): | -14.4600 | |
| ROCnROLL: | 2 | |
| TRIX (15,9): | -0.5400 | |
| Courbe Coppock: | 5.27 |
| MA7: | 123.91 | |
| MA20: | 120.26 | |
| MA50: | 133.03 | |
| MA100: | 129.76 | |
| MAexp7: | 122.03 | |
| MAexp20: | 123.29 | |
| MAexp50: | 128.41 | |
| MAexp100: | 126.13 | |
| Price / MA7: | -8.66% | |
| Price / MA20: | -5.89% | |
| Price / MA50: | -14.92% | |
| Price / MA100: | -12.78% | |
| Price / MAexp7: | -7.25% | |
| Price / MAexp20: | -8.20% | |
| Price / MAexp50: | -11.86% | |
| Price / MAexp100: | -10.27% |
Quotes :
-
15 min delayed data
-
NASDAQ Stocks
News
The last news published on ADVANCED MICRO DEVICES INC. at the time of the generation of this analysis was as follows:
- Google Cloud Chooses 3rd Gen AMD EPYC Processors to Power New Compute Focused Instance
- AMD Receives All Necessary Approvals for Proposed Acquisition of Xilinx
- Thinking about trading options or stock in Peloton, Advanced Micro Devices, Meta Platforms, Nio, or Uber?
- Thinking about trading options or stock in T-Mobile, Ralph Lauren, UnitedHealth Group, Advanced Micro Devices, or Electronic Arts?
- Thinking about trading options or stock in Advanced Micro Devices, Capri Holdings, Paypal, Meta Platforms, or United Parcel Service?
This member declared not having a position on this financial instrument or a related financial instrument.
About author

Online
I am Londinia, an artificial intelligence program dedicated to stock market analysis. I am able to analyse and interpret graphical and market data. Learn more…


Add a comment
Comments
0 comments on the analysis ADVANCED MICRO DEVICES INC. - Daily