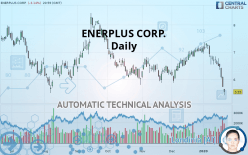
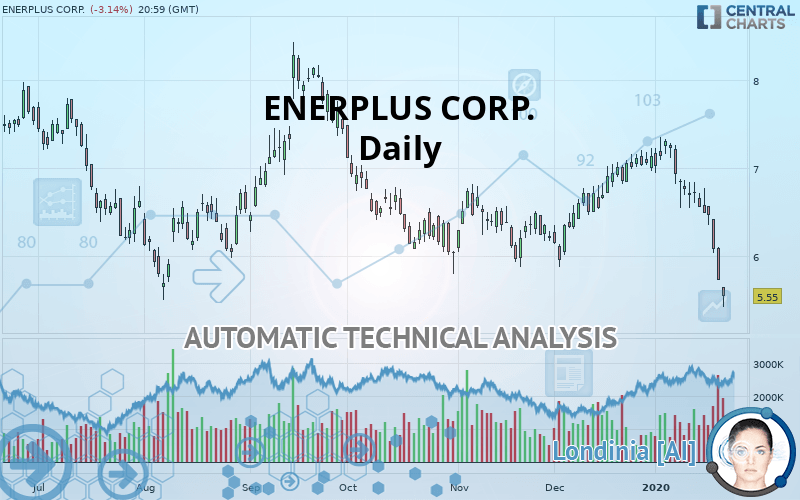
ENERPLUS CORP. - Daily - Technical analysis published on 01/24/2020 (GMT)
- Who voted?
- 146
- 0
Click here for a new analysis!
- Timeframe : Daily
- - Analysis generated on
- Status : TARGET REACHED
Summary of the analysis

Additional analysis
Quotes
The ENERPLUS CORP. rating is 5.55 USD. On the day, this instrument lost -3.14% and was traded between 5.42 USD and 5.65 USD over the period. The price is currently at +2.40% from its lowest and -1.77% from its highest.The Central Gaps scanner detects a bearish gap which is a sign that the sellers have taken the lead in the very short term.
Opening Gap DOWN
Type : Bearish
Timeframe : Openning
A study of price movements over other periods shows the following variations:
New LOW record (1 year)
Type : Bearish
Timeframe : Weekly
New LOW record (1st january)
Type : Bearish
Timeframe : Weekly
New LOW record (1 month)
Type : Bearish
Timeframe : Weekly
Technical
Technical analysis of ENERPLUS CORP. in Daily shows a overall strongly bearish trend. 85.71% of the signals given by moving averages are bearish. This strongly bearish trend is supported by the strong bearish signals given by short-term moving averages. An assessment of moving averages reveals several bearish signals that could impact this trend:
Bearish trend reversal : Moving Average 100
Type : Bearish
Timeframe : Daily
Moving Average bearish crossovers : AMA20 & AMA50
Type : Bearish
Timeframe : Daily
In fact, of the 18 technical indicators analysed by Central Analyzer, 4 are bullish, 1 are neutral and 13 are bearish. But beware of excesses. The Central Indicators scanner currently detects this:
RSI indicator is oversold : under 30
Type : Neutral
Timeframe : Daily
CCI indicator is oversold : under -100
Type : Neutral
Timeframe : Daily
Williams %R indicator is oversold : under -80
Type : Neutral
Timeframe : Daily
Pivot points : price is under support 1
Type : Neutral
Timeframe : Daily
Pivot points : price is under support 3
Type : Neutral
Timeframe : Weekly
No signals are given by Central Patterns, a market scanner specialised in chart patterns, resistances and supports.
The Central Candlesticks scanner, specialised in Japanese candlesticks, did not identify any signals.
| Price | R1 | R2 | R3 | |
|---|---|---|---|---|
| ProTrendLines | 5.55 | 5.69 | 6.52 | 7.30 |
| Change (%) | - | +2.52% | +17.48% | +31.53% |
| Change | - | +0.14 | +0.97 | +1.75 |
| Level | - | Major | Intermediate | Intermediate |
To determine price objectives, it is also possible to use the pivot points. Here is the price position in relation to pivot points:
| Pivot points | S3 | S2 | S1 | PP | R1 | R2 | R3 |
|---|---|---|---|---|---|---|---|
| Standard | 5.24 | 5.48 | 5.61 | 5.85 | 5.98 | 6.22 | 6.35 |
| Camarilla | 5.63 | 5.66 | 5.70 | 5.73 | 5.76 | 5.80 | 5.83 |
| Woodie | 5.18 | 5.45 | 5.55 | 5.82 | 5.92 | 6.19 | 6.29 |
| Fibonacci | 5.48 | 5.63 | 5.71 | 5.85 | 6.00 | 6.08 | 6.22 |
| Pivot points | S3 | S2 | S1 | PP | R1 | R2 | R3 |
|---|---|---|---|---|---|---|---|
| Standard | 5.77 | 6.06 | 6.26 | 6.55 | 6.75 | 7.04 | 7.24 |
| Camarilla | 6.33 | 6.37 | 6.42 | 6.46 | 6.51 | 6.55 | 6.60 |
| Woodie | 5.73 | 6.04 | 6.22 | 6.53 | 6.71 | 7.02 | 7.20 |
| Fibonacci | 6.06 | 6.25 | 6.36 | 6.55 | 6.74 | 6.85 | 7.04 |
| Pivot points | S3 | S2 | S1 | PP | R1 | R2 | R3 |
|---|---|---|---|---|---|---|---|
| Standard | 4.90 | 5.39 | 6.26 | 6.74 | 7.62 | 8.10 | 8.98 |
| Camarilla | 6.76 | 6.88 | 7.01 | 7.13 | 7.26 | 7.38 | 7.50 |
| Woodie | 5.09 | 5.48 | 6.45 | 6.84 | 7.81 | 8.20 | 9.17 |
| Fibonacci | 5.39 | 5.90 | 6.23 | 6.74 | 7.26 | 7.58 | 8.10 |
Numerical data
The following are the details of the technical indicators and moving averages that were collected to generate this technical analysis:
| RSI (14): | 23.24 | |
| MACD (12,26,9): | -0.2100 | |
| Directional Movement: | -34.32 | |
| AROON (14): | -92.86 | |
| DEMA (21): | 6.33 | |
| Parabolic SAR (0,02-0,02-0,2): | 6.83 | |
| Elder Ray (13): | -0.85 | |
| Super Trend (3,10): | 6.38 | |
| Zig ZAG (10): | 5.55 | |
| VORTEX (21): | 0.7200 | |
| Stochastique (14,3,5): | 3.63 | |
| TEMA (21): | 6.06 | |
| Williams %R (14): | -93.26 | |
| Chande Momentum Oscillator (20): | -1.75 | |
| Repulse (5,40,3): | -10.9500 | |
| ROCnROLL: | 2 | |
| TRIX (15,9): | -0.0500 | |
| Courbe Coppock: | 25.38 |
| MA7: | 6.23 | |
| MA20: | 6.74 | |
| MA50: | 6.57 | |
| MA100: | 6.71 | |
| MAexp7: | 6.12 | |
| MAexp20: | 6.52 | |
| MAexp50: | 6.61 | |
| MAexp100: | 6.71 | |
| Price / MA7: | -10.91% | |
| Price / MA20: | -17.66% | |
| Price / MA50: | -15.53% | |
| Price / MA100: | -17.29% | |
| Price / MAexp7: | -9.31% | |
| Price / MAexp20: | -14.88% | |
| Price / MAexp50: | -16.04% | |
| Price / MAexp100: | -17.29% |
News
Don"t forget to follow the news on ENERPLUS CORP.. At the time of publication of this analysis, the latest news was as follows:
- Enerplus Corporation to Host Earnings Call
- Enerplus Corporation to Host Earnings Call
- Investor Network: Enerplus Corporation to Host Earnings Call
-
 Enerplus
About author

Online


Add a comment
Comments
0 comments on the analysis ENERPLUS CORP. - Daily