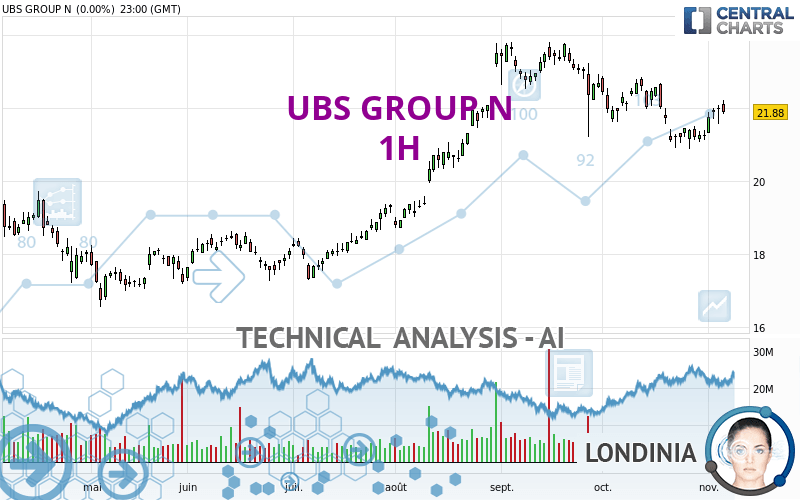
UBS GROUP N - 1H - Technical analysis published on 11/07/2023 (GMT)
- 100
- 0
Click here for a new analysis!
- Timeframe : 1H
- - Analysis generated on
- Status : INVALID
Summary of the analysis

Additional analysis
Quotes
The UBS GROUP N price is 22.8000 CHF. The price has increased by +4.21% since the last closing and was traded between 21.8300 CHF and 22.9800 CHF over the period. The price is currently at +4.44% from its lowest and -0.78% from its highest.Here is a more detailed summary of the historical variations registered by UBS GROUP N:
Near a new HIGH record (5 years)
Type : Bullish
Timeframe : Weekly
Near a new HIGH record (1 year)
Type : Bullish
Timeframe : Weekly
Near a new HIGH record (1st january)
Type : Bullish
Timeframe : Weekly
New HIGH record (1 month)
Type : Bullish
Timeframe : Weekly
Technical
A technical analysis in 1H of this UBS GROUP N chart shows a strongly bullish trend. The signals given by the moving averages are 92.86% bullish. This strong bullish trend is confirmed by the strong signals currently being given by short-term moving averages. An assessment of moving averages reveals a bullish signal that could impact this trend:
Bullish price crossover with Moving Average 20
Type : Bullish
Timeframe : 1 hour
An assessment of technical indicators shows a strong bullish signal.
But beware of excesses. The Central Indicators scanner currently detects this:
RSI indicator is overbought : over 80
Type : Neutral
Timeframe : 1 hour
CCI indicator is overbought : over 100
Type : Neutral
Timeframe : 1 hour
Williams %R indicator is overbought : over -20
Type : Neutral
Timeframe : 1 hour
Pivot points : price is over resistance 2
Type : Neutral
Timeframe : Weekly
Pivot points : price is over resistance 3
Type : Neutral
Timeframe : 1 hour
MACD crosses UP its Moving Average
Type : Bullish
Timeframe : 1 hour
Parabolic SAR indicator bullish reversal
Type : Bullish
Timeframe : 1 hour
Momentum indicator is back over 0
Type : Bullish
Timeframe : 1 hour
Central Patterns, the market scanner focusing on chart patterns, resistances and supports found this result:
Near support of triangle
Type : Bullish
Timeframe : 1 hour
The presence of a bullish Japanese candlestick pattern detected by Central Candlesticks that could cause a very short term rebound was also detected:
Long white line
Type : Bullish
Timeframe : 1 hour
| S3 | S2 | S1 | Price | R1 | |
|---|---|---|---|---|---|
| ProTrendLines | 21.9100 | 22.2100 | 22.7040 | 22.8000 | 23.7400 |
| Change (%) | -3.90% | -2.59% | -0.42% | - | +4.12% |
| Change | -0.8900 | -0.5900 | -0.0960 | - | +0.9400 |
| Level | Intermediate | Minor | Major | - | Major |
To determine price objectives, it is also possible to use the pivot points. Here is the price position in relation to pivot points:
| Pivot points | S3 | S2 | S1 | PP | R1 | R2 | R3 |
|---|---|---|---|---|---|---|---|
| Standard | 21.3400 | 21.5800 | 21.7300 | 21.9700 | 22.1200 | 22.3600 | 22.5100 |
| Camarilla | 21.7728 | 21.8085 | 21.8443 | 21.8800 | 21.9158 | 21.9515 | 21.9873 |
| Woodie | 21.2950 | 21.5575 | 21.6850 | 21.9475 | 22.0750 | 22.3375 | 22.4650 |
| Fibonacci | 21.5800 | 21.7290 | 21.8210 | 21.9700 | 22.1190 | 22.2110 | 22.3600 |
| Pivot points | S3 | S2 | S1 | PP | R1 | R2 | R3 |
|---|---|---|---|---|---|---|---|
| Standard | 20.3300 | 20.7000 | 21.3400 | 21.7100 | 22.3500 | 22.7200 | 23.3600 |
| Camarilla | 21.7023 | 21.7948 | 21.8874 | 21.9800 | 22.0726 | 22.1652 | 22.2578 |
| Woodie | 20.4650 | 20.7675 | 21.4750 | 21.7775 | 22.4850 | 22.7875 | 23.4950 |
| Fibonacci | 20.7000 | 21.0858 | 21.3242 | 21.7100 | 22.0958 | 22.3342 | 22.7200 |
| Pivot points | S3 | S2 | S1 | PP | R1 | R2 | R3 |
|---|---|---|---|---|---|---|---|
| Standard | 18.4400 | 19.6600 | 20.4400 | 21.6600 | 22.4400 | 23.6600 | 24.4400 |
| Camarilla | 20.6700 | 20.8533 | 21.0367 | 21.2200 | 21.4033 | 21.5867 | 21.7700 |
| Woodie | 18.2200 | 19.5500 | 20.2200 | 21.5500 | 22.2200 | 23.5500 | 24.2200 |
| Fibonacci | 19.6600 | 20.4240 | 20.8960 | 21.6600 | 22.4240 | 22.8960 | 23.6600 |
Numerical data
The following is the status of technical indicators and moving averages registered at the time this technical analysis was created:
| RSI (14): | 79.60 | |
| MACD (12,26,9): | 0.1389 | |
| Directional Movement: | 43.6415 | |
| AROON (14): | 100.0000 | |
| DEMA (21): | 22.1648 | |
| Parabolic SAR (0,02-0,02-0,2): | 21.8200 | |
| Elder Ray (13): | 0.3492 | |
| Super Trend (3,10): | 21.7428 | |
| Zig ZAG (10): | 22.9100 | |
| VORTEX (21): | 0.9894 | |
| Stochastique (14,3,5): | 58.01 | |
| TEMA (21): | 22.1873 | |
| Williams %R (14): | -11.90 | |
| Chande Momentum Oscillator (20): | 0.8200 | |
| Repulse (5,40,3): | 4.7337 | |
| ROCnROLL: | 1 | |
| TRIX (15,9): | 0.0695 | |
| Courbe Coppock: | 2.45 |
| MA7: | 21.8343 | |
| MA20: | 21.8275 | |
| MA50: | 22.4722 | |
| MA100: | 20.7750 | |
| MAexp7: | 22.1420 | |
| MAexp20: | 21.9804 | |
| MAexp50: | 21.7742 | |
| MAexp100: | 21.6866 | |
| Price / MA7: | +4.42% | |
| Price / MA20: | +4.46% | |
| Price / MA50: | +1.46% | |
| Price / MA100: | +9.75% | |
| Price / MAexp7: | +2.97% | |
| Price / MAexp20: | +3.73% | |
| Price / MAexp50: | +4.71% | |
| Price / MAexp100: | +5.13% |
News
Don't forget to follow the news on UBS GROUP N. At the time of publication of this analysis, the latest news was as follows:
- SHAREHOLDER ALERT: Pomerantz Law Firm Investigates Claims On Behalf of Investors of UBS Group AG - UBS
- SHAREHOLDER ALERT: Pomerantz Law Firm Investigates Claims On Behalf of Investors of UBS Group AG - UBS
- SHAREHOLDER ALERT: Pomerantz Law Firm Investigates Claims On Behalf of Investors of UBS Group AG - UBS
- SHAREHOLDER ALERT: Pomerantz Law Firm Investigates Claims On Behalf of Investors of UBS Group AG - UBS
- Thinking about buying stock in Nio, PacWest Bancorp, KeyCorp, Riot Platforms, or UBS Group AG?
About author
Online


Add a comment
Comments
0 comments on the analysis UBS GROUP N - 1H