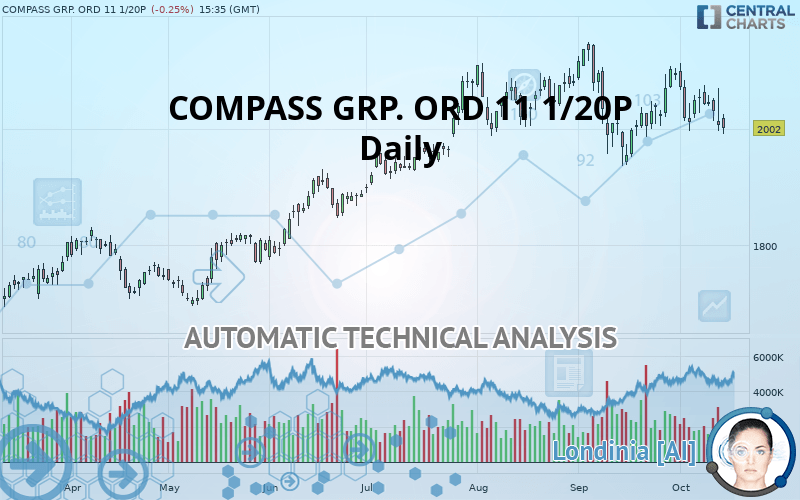
COMPASS GRP. ORD 11 1/20P - Daily - Technical analysis published on 10/14/2019 (GMT)
- Who voted?
- 353
- 0
- Timeframe : Daily
- - Analysis generated on
- Status : NEUTRAL
Summary of the analysis

Additional analysis
Quotes
The COMPASS GRP. ORD 11 1/20P price is 2,002.0 GBX. On the day, this instrument lost -0.25% and was between 1,991.5 GBX and 2,026.0 GBX. This implies that the price is at +0.53% from its lowest and at -1.18% from its highest.A bullish opening was detected by the Central Gaps scanner. Buyers are trying to impose a bullish momentum in the very short term.
Bullish opening
Type : Bullish
Timeframe : Openning
So that you have an overall view of the price change, here is a table showing the variations over several periods:
Technical
Technical analysis of this Daily chart of COMPASS GRP. ORD 11 1/20P indicates that the overall trend is not clearly defined. The slightly bearish signals currently given by short-term moving averages could allow the overall trend to return to a slightly bearish trend. An assessment of moving averages reveals several bearish signals that could impact this trend:
Bearish trend reversal : adaptative moving average 50
Type : Bearish
Timeframe : Daily
Bearish price crossover with adaptative moving average 100
Type : Bearish
Timeframe : Daily
In fact, 12 technical indicators on 18 studied are currently positioned bearish. But beware of excesses. The Central Indicators scanner currently detects this:
Williams %R indicator is oversold : under -80
Type : Neutral
Timeframe : Daily
Parabolic SAR indicator bearish reversal
Type : Bearish
Timeframe : Daily
Ichimoku : price is under the cloud
Type : Bearish
Timeframe : Daily
MACD indicator is back under 0
Type : Bearish
Timeframe : Daily
Price is back under the pivot point
Type : Bearish
Timeframe : Weekly
An analysis of the price chart with the Central Patterns scanner (detector of chart patterns and resistances and supports) shows several results that can have an impact on the price change:
Near horizontal support
Type : Bullish
Timeframe : Daily
Support of channel is broken
Type : Bearish
Timeframe : Daily
Support of triangle is broken
Type : Bearish
Timeframe : Daily
The Central Candlesticks scanner, specialised in Japanese candlesticks, did not identify any signals.
| S3 | S2 | S1 | Price | R1 | R2 | |
|---|---|---|---|---|---|---|
| ProTrendLines | 1,758.3 | 1,825.0 | 1,955.1 | 2,002.0 | 2,051.7 | 2,138.0 |
| Change (%) | -12.17% | -8.84% | -2.34% | - | +2.48% | +6.79% |
| Change | -243.7 | -177.0 | -46.9 | - | +49.7 | +136.0 |
| Level | Intermediate | Intermediate | Intermediate | - | Minor | Major |
Pivot points can also be used to set your price objectives. Here is the price situation in relation to pivot points:
| Pivot points | S3 | S2 | S1 | PP | R1 | R2 | R3 |
|---|---|---|---|---|---|---|---|
| Standard | 1,905.5 | 1,951.0 | 1,979.0 | 2,024.5 | 2,052.5 | 2,098.0 | 2,126.0 |
| Camarilla | 1,986.8 | 1,993.5 | 2,000.3 | 2,007.0 | 2,013.7 | 2,020.5 | 2,027.2 |
| Woodie | 1,896.8 | 1,946.6 | 1,970.3 | 2,020.1 | 2,043.8 | 2,093.6 | 2,117.3 |
| Fibonacci | 1,951.0 | 1,979.1 | 1,996.4 | 2,024.5 | 2,052.6 | 2,069.9 | 2,098.0 |
| Pivot points | S3 | S2 | S1 | PP | R1 | R2 | R3 |
|---|---|---|---|---|---|---|---|
| Standard | 1,898.8 | 1,947.7 | 1,977.3 | 2,026.2 | 2,055.8 | 2,104.7 | 2,134.3 |
| Camarilla | 1,985.4 | 1,992.6 | 1,999.8 | 2,007.0 | 2,014.2 | 2,021.4 | 2,028.6 |
| Woodie | 1,889.3 | 1,942.9 | 1,967.8 | 2,021.4 | 2,046.3 | 2,099.9 | 2,124.8 |
| Fibonacci | 1,947.7 | 1,977.7 | 1,996.2 | 2,026.2 | 2,056.2 | 2,074.7 | 2,104.7 |
| Pivot points | S3 | S2 | S1 | PP | R1 | R2 | R3 |
|---|---|---|---|---|---|---|---|
| Standard | 1,755.3 | 1,845.7 | 1,969.3 | 2,059.7 | 2,183.3 | 2,273.7 | 2,397.3 |
| Camarilla | 2,034.2 | 2,053.8 | 2,073.4 | 2,093.0 | 2,112.6 | 2,132.2 | 2,151.9 |
| Woodie | 1,772.0 | 1,854.0 | 1,986.0 | 2,068.0 | 2,200.0 | 2,282.0 | 2,414.0 |
| Fibonacci | 1,845.7 | 1,927.4 | 1,977.9 | 2,059.7 | 2,141.4 | 2,191.9 | 2,273.7 |
Numerical data
The following is the status of technical indicators and moving averages registered at the time this technical analysis was created:
| RSI (14): | 43.50 | |
| MACD (12,26,9): | -4.4000 | |
| Directional Movement: | -2.4 | |
| AROON (14): | -64.3 | |
| DEMA (21): | 2,031.4 | |
| Parabolic SAR (0,02-0,02-0,2): | 2,110.7 | |
| Elder Ray (13): | -23.7 | |
| Super Trend (3,10): | 1,964.9 | |
| Zig ZAG (10): | 2,002.0 | |
| VORTEX (21): | 1.0000 | |
| Stochastique (14,3,5): | 16.00 | |
| TEMA (21): | 2,023.1 | |
| Williams %R (14): | -91.40 | |
| Chande Momentum Oscillator (20): | -68.0 | |
| Repulse (5,40,3): | -3.0000 | |
| ROCnROLL: | 2 | |
| TRIX (15,9): | 0.0000 | |
| Courbe Coppock: | 0.10 |
| MA7: | 2,033.1 | |
| MA20: | 2,036.3 | |
| MA50: | 2,044.9 | |
| MA100: | 1,977.5 | |
| MAexp7: | 2,025.5 | |
| MAexp20: | 2,035.4 | |
| MAexp50: | 2,025.3 | |
| MAexp100: | 1,971.6 | |
| Price / MA7: | -1.53% | |
| Price / MA20: | -1.68% | |
| Price / MA50: | -2.10% | |
| Price / MA100: | +1.24% | |
| Price / MAexp7: | -1.16% | |
| Price / MAexp20: | -1.64% | |
| Price / MAexp50: | -1.15% | |
| Price / MAexp100: | +1.54% |
News
The last news published on COMPASS GRP. ORD 11 1/20P at the time of the generation of this analysis was as follows:
- J.P. Morgan Brings New Capabilities to Target Date Compass© Program
- Black Knight Announces Acquisition of Compass Analytics, a Leading Provider of Secondary Market Capabilities
- ForgeRock Recognized as Best-in-Class in KuppingerCole Leadership Compass for Identity API Platforms
- Compass Gold Corporation Intersects New High-Grade Gold Veins at Farabakoura Including 6.1 m @ 65.6 g/t Gold
- Auth0 Named Overall Leader in KuppingerCole Leadership Compass Reports for IDaaS and Identity API Platforms
About author

Online


Add a comment
Comments
0 comments on the analysis COMPASS GRP. ORD 11 1/20P - Daily