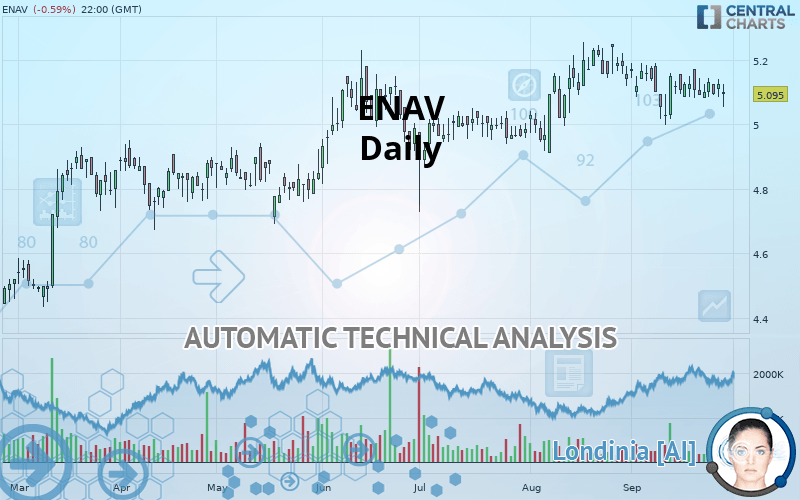
ENAV - Daily - Technical analysis published on 09/30/2019 (GMT)
- Who voted?
- 124
- 0
Click here for a new analysis!
- Timeframe : Daily
- - Analysis generated on
- Status : TARGET REACHED
Summary of the analysis

Additional analysis
Quotes
The ENAV rating is 5.095 EUR. The price registered a decrease of -0.59% on the session and was between 5.055 EUR and 5.125 EUR. This implies that the price is at +0.79% from its lowest and at -0.59% from its highest.The Central Gaps scanner detects a bearish opening. A small advantage for sellers in the very short term.
Bearish opening
Type : Bearish
Timeframe : Openning
Here is a more detailed summary of the historical variations registered by ENAV:
Near a new HIGH record (1 year)
Type : Bullish
Timeframe : Weekly
Near a new HIGH record (1st january)
Type : Bullish
Timeframe : Weekly
Technical
A technical analysis in Daily of this ENAV chart shows a bullish trend. 71.43% of the signals given by moving averages are bullish. Caution: the neutral signals currently given by the short-term moving averages indicate that this bullish trend is showing signs of running out of steam. An assessment of moving averages reveals a bullish signal that could impact this trend:
Bullish price crossover with Moving Average 20
Type : Bullish
Timeframe : Daily
The technical indicators are generally neutral. They do not provide relevant information on the direction of future price movements.
Central Indicators, the scanner specialised in technical indicators, has identified these signals:
Pivot points : price is under support 1
Type : Neutral
Timeframe : Daily
RSI indicator is back over 50
Type : Bullish
Timeframe : Daily
MACD indicator is back over 0
Type : Bullish
Timeframe : Daily
Price is back over the pivot point
Type : Bullish
Timeframe : Daily
An analysis of the price chart with the Central Patterns scanner (detector of chart patterns and resistances and supports) shows several results that can have an impact on the price change:
Near resistance of channel
Type : Bearish
Timeframe : Daily
Near resistance of triangle
Type : Bearish
Timeframe : Daily
Near horizontal support
Type : Bullish
Timeframe : Daily
No result was found by the Central Candlesticks scanner on Japanese candlesticks.
| S3 | S2 | S1 | Price | R1 | R2 | |
|---|---|---|---|---|---|---|
| ProTrendLines | 4.696 | 4.896 | 5.025 | 5.095 | 5.145 | 5.239 |
| Change (%) | -7.83% | -3.91% | -1.37% | - | +0.98% | +2.83% |
| Change | -0.399 | -0.199 | -0.070 | - | +0.050 | +0.144 |
| Level | Major | Major | Major | - | Major | Minor |
Pivot points can also be used to set your price objectives. Here is the price situation in relation to pivot points:
| Pivot points | S3 | S2 | S1 | PP | R1 | R2 | R3 |
|---|---|---|---|---|---|---|---|
| Standard | 5.035 | 5.060 | 5.095 | 5.120 | 5.155 | 5.180 | 5.215 |
| Camarilla | 5.114 | 5.119 | 5.125 | 5.130 | 5.136 | 5.141 | 5.147 |
| Woodie | 5.040 | 5.063 | 5.100 | 5.123 | 5.160 | 5.183 | 5.220 |
| Fibonacci | 5.060 | 5.083 | 5.097 | 5.120 | 5.143 | 5.157 | 5.180 |
| Pivot points | S3 | S2 | S1 | PP | R1 | R2 | R3 |
|---|---|---|---|---|---|---|---|
| Standard | 4.823 | 4.911 | 5.015 | 5.103 | 5.207 | 5.295 | 5.399 |
| Camarilla | 5.067 | 5.085 | 5.102 | 5.120 | 5.138 | 5.155 | 5.173 |
| Woodie | 4.832 | 4.915 | 5.024 | 5.107 | 5.216 | 5.299 | 5.408 |
| Fibonacci | 4.911 | 4.984 | 5.029 | 5.103 | 5.176 | 5.221 | 5.295 |
| Pivot points | S3 | S2 | S1 | PP | R1 | R2 | R3 |
|---|---|---|---|---|---|---|---|
| Standard | 4.607 | 4.759 | 4.950 | 5.102 | 5.293 | 5.445 | 5.636 |
| Camarilla | 5.046 | 5.077 | 5.109 | 5.140 | 5.171 | 5.203 | 5.234 |
| Woodie | 4.626 | 4.769 | 4.969 | 5.112 | 5.312 | 5.455 | 5.655 |
| Fibonacci | 4.759 | 4.890 | 4.971 | 5.102 | 5.233 | 5.314 | 5.445 |
Numerical data
The following are the details of the technical indicators and moving averages that were collected to generate this technical analysis:
| RSI (14): | 47.96 | |
| MACD (12,26,9): | -0.0010 | |
| Directional Movement: | 3.262 | |
| AROON (14): | -14.285 | |
| DEMA (21): | 5.117 | |
| Parabolic SAR (0,02-0,02-0,2): | 5.011 | |
| Elder Ray (13): | -0.005 | |
| Super Trend (3,10): | 4.982 | |
| Zig ZAG (10): | 5.095 | |
| VORTEX (21): | 0.8950 | |
| Stochastique (14,3,5): | 57.47 | |
| TEMA (21): | 5.098 | |
| Williams %R (14): | -49.48 | |
| Chande Momentum Oscillator (20): | -0.005 | |
| Repulse (5,40,3): | -0.5370 | |
| ROCnROLL: | -1 | |
| TRIX (15,9): | 0.0090 | |
| Courbe Coppock: | 1.32 |
| MA7: | 5.110 | |
| MA20: | 5.120 | |
| MA50: | 5.090 | |
| MA100: | 5.020 | |
| MAexp7: | 5.108 | |
| MAexp20: | 5.114 | |
| MAexp50: | 5.088 | |
| MAexp100: | 5.004 | |
| Price / MA7: | -0.29% | |
| Price / MA20: | -0.49% | |
| Price / MA50: | +0.10% | |
| Price / MA100: | +1.49% | |
| Price / MAexp7: | -0.25% | |
| Price / MAexp20: | -0.37% | |
| Price / MAexp50: | +0.14% | |
| Price / MAexp100: | +1.82% |
About author

Online


Add a comment
Comments
0 comments on the analysis ENAV - Daily