FORESTAR GROUP INC - Daily - Technical analysis published on 02/26/2020 (GMT)
- 237
- 0
Click here for a new analysis!
- Timeframe : Daily
- - Analysis generated on
- Status : TARGET REACHED
Summary of the analysis

Additional analysis
Quotes
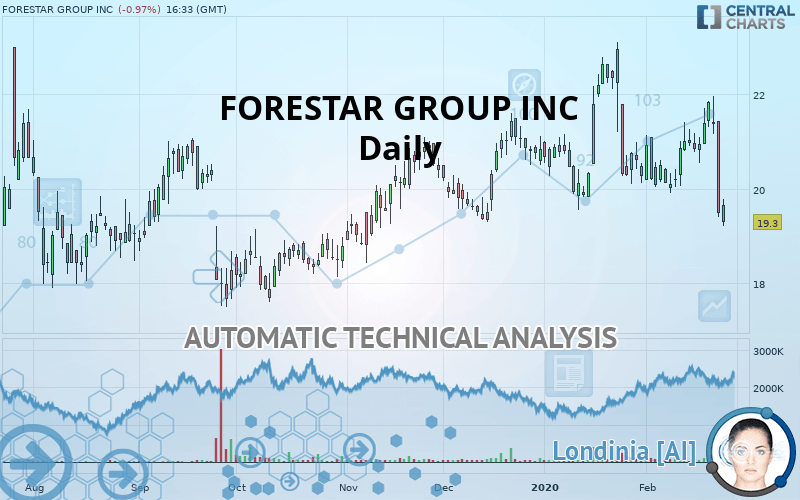
The FORESTAR GROUP INC rating is 19.30 USD. The price registered a decrease of -0.98% on the session and was between 19.20 USD and 19.78 USD. This implies that the price is at +0.52% from its lowest and at -2.43% from its highest.The Central Gaps scanner detects a bullish opening marking the presence of buyers ahead of sellers at the opening but not sufficiently marked to allow the price to register a quotation gap.
Bullish opening
Type : Bullish
Timeframe : Openning
Here is a more detailed summary of the historical variations registered by FORESTAR GROUP INC:
Technical
Technical analysis of this Daily chart of FORESTAR GROUP INC indicates that the overall trend is bearish. 64.29% of the signals given by moving averages are bearish. This bearish trend is supported by the strong bearish signals given by short-term moving averages. An assessment of moving averages reveals several bearish signals that could impact this trend:
Bearish trend reversal : adaptative moving average 20
Type : Bearish
Timeframe : Daily
Bearish trend reversal : adaptative moving average 50
Type : Bearish
Timeframe : Daily
Bearish trend reversal : adaptative moving average 100
Type : Bearish
Timeframe : Daily
Bearish price crossover with Moving Average 20
Type : Bearish
Timeframe : Daily
Bearish price crossover with Moving Average 50
Type : Bearish
Timeframe : Daily
Bearish price crossover with Moving Average 100
Type : Bearish
Timeframe : Daily
Bearish price crossover with adaptative moving average 20
Type : Bearish
Timeframe : Daily
Bearish price crossover with adaptative moving average 50
Type : Bearish
Timeframe : Daily
Bearish price crossover with adaptative moving average 100
Type : Bearish
Timeframe : Daily
Technical indicators are bearish. There is still some doubt about the decline in the price.
Caution: the Central Indicators scanner currently detects an excess:
CCI indicator is oversold : under -100
Type : Neutral
Timeframe : Daily
Williams %R indicator is oversold : under -80
Type : Neutral
Timeframe : Daily
Pivot points : price is under support 3
Type : Neutral
Timeframe : Weekly
RSI indicator is back under 50
Type : Bearish
Timeframe : Daily
MACD crosses DOWN its Moving Average
Type : Bearish
Timeframe : Daily
Parabolic SAR indicator bearish reversal
Type : Bearish
Timeframe : Daily
Ichimoku : price is under the cloud
Type : Bearish
Timeframe : Daily
Price is back over the pivot point
Type : Bullish
Timeframe : Weekly
Price is back under the pivot point
Type : Bearish
Timeframe : Daily
Momentum indicator is back under 0
Type : Bearish
Timeframe : Daily
Williams %R indicator is back under -50
Type : Bearish
Timeframe : Daily
The Central Patterns scanner, which studies chart patterns, resistances and supports, has identified this signal:
Horizontal support is broken
Type : Bearish
Timeframe : Daily
For a small setback in the very short term, the Central Candlesticks scanner currently notes the presence of this bearish pattern in Japanese candlesticks:
Bearish engulfing lines
Type : Bearish
Timeframe : Daily
| S3 | S2 | S1 | Price | R1 | R2 | R3 | |
|---|---|---|---|---|---|---|---|
| ProTrendLines | 17.64 | 18.39 | 19.06 | 19.30 | 19.51 | 20.35 | 20.90 |
| Change (%) | -8.60% | -4.72% | -1.24% | - | +1.09% | +5.44% | +8.29% |
| Change | -1.66 | -0.91 | -0.24 | - | +0.21 | +1.05 | +1.60 |
| Level | Intermediate | Intermediate | Minor | - | Minor | Major | Major |
To determine price objectives, it is also possible to use the pivot points. Here is the price position in relation to pivot points:
| Pivot points | S3 | S2 | S1 | PP | R1 | R2 | R3 |
|---|---|---|---|---|---|---|---|
| Standard | 16.72 | 18.06 | 18.77 | 20.11 | 20.82 | 22.16 | 22.87 |
| Camarilla | 18.93 | 19.11 | 19.30 | 19.49 | 19.68 | 19.87 | 20.05 |
| Woodie | 16.42 | 17.90 | 18.47 | 19.95 | 20.52 | 22.00 | 22.57 |
| Fibonacci | 18.06 | 18.84 | 19.32 | 20.11 | 20.89 | 21.37 | 22.16 |
| Pivot points | S3 | S2 | S1 | PP | R1 | R2 | R3 |
|---|---|---|---|---|---|---|---|
| Standard | 19.65 | 20.10 | 20.97 | 21.42 | 22.29 | 22.73 | 23.60 |
| Camarilla | 21.48 | 21.60 | 21.72 | 21.84 | 21.96 | 22.08 | 22.20 |
| Woodie | 19.87 | 20.21 | 21.18 | 21.52 | 22.50 | 22.84 | 23.81 |
| Fibonacci | 20.10 | 20.60 | 20.91 | 21.42 | 21.92 | 22.23 | 22.73 |
| Pivot points | S3 | S2 | S1 | PP | R1 | R2 | R3 |
|---|---|---|---|---|---|---|---|
| Standard | 15.28 | 17.42 | 18.84 | 20.98 | 22.40 | 24.54 | 25.96 |
| Camarilla | 19.29 | 19.62 | 19.94 | 20.27 | 20.60 | 20.92 | 21.25 |
| Woodie | 14.93 | 17.24 | 18.49 | 20.80 | 22.05 | 24.36 | 25.61 |
| Fibonacci | 17.42 | 18.78 | 19.62 | 20.98 | 22.34 | 23.18 | 24.54 |
Numerical data
The following is the status of the technical indicators and moving averages at the time of publication of this technical analysis:
| RSI (14): | 37.22 | |
| MACD (12,26,9): | -0.1100 | |
| Directional Movement: | -11.58 | |
| AROON (14): | -14.29 | |
| DEMA (21): | 20.58 | |
| Parabolic SAR (0,02-0,02-0,2): | 21.96 | |
| Elder Ray (13): | -1.11 | |
| Super Trend (3,10): | 21.76 | |
| Zig ZAG (10): | 19.36 | |
| VORTEX (21): | 0.9100 | |
| Stochastique (14,3,5): | 27.77 | |
| TEMA (21): | 20.42 | |
| Williams %R (14): | -94.37 | |
| Chande Momentum Oscillator (20): | -0.77 | |
| Repulse (5,40,3): | -10.1500 | |
| ROCnROLL: | 2 | |
| TRIX (15,9): | -0.0100 | |
| Courbe Coppock: | 2.19 |
| MA7: | 20.75 | |
| MA20: | 20.59 | |
| MA50: | 20.81 | |
| MA100: | 20.05 | |
| MAexp7: | 20.42 | |
| MAexp20: | 20.66 | |
| MAexp50: | 20.60 | |
| MAexp100: | 20.26 | |
| Price / MA7: | -6.99% | |
| Price / MA20: | -6.27% | |
| Price / MA50: | -7.26% | |
| Price / MA100: | -3.74% | |
| Price / MAexp7: | -5.48% | |
| Price / MAexp20: | -6.58% | |
| Price / MAexp50: | -6.31% | |
| Price / MAexp100: | -4.74% |
News
The last news published on FORESTAR GROUP INC at the time of the generation of this analysis was as follows:
- Shareholder Alert: Monteverde & Associates Pc Announces An Investigation Of Forestar Group Inc - For
- Hynes Keller & Hernandez, LLC Investigates Adequacy of Price and Process in Proposed Sale of Forestar Group, Inc. (FOR)
- SHAREHOLDER ALERT: Levi & Korsinsky, LLP Announces an Investigation Into Whether the Sale of Forestar Group Inc. to Starwood Capital Group for $14.25 Per Share is Fair to Shareholders - FOR
- FORESTAR INVESTOR ALERT BY THE FORMER ATTORNEY GENERAL OF LOUISIANA: Kahn Swick & Foti, LLC Investigates Adequacy of Price and Process in Proposed Sale of Forestar Group, Inc.
- Wolf Popper LLP Investigates the Proposed Acquisition of Forestar Group Inc. by Starwood Capital Group
About author

Online


Add a comment
Comments
0 comments on the analysis FORESTAR GROUP INC - Daily