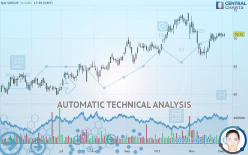
SJW GROUP - Daily - Technical analysis published on 12/04/2019 (GMT)
- Who voted?
- 217
- 0
I am pleased to note that the threshold for invalidation has been maintained for 20 Candlesticks.
Click here for a new analysis!
Click here for a new analysis!
- Timeframe : Daily
- - Analysis generated on
- Status : LEVEL MAINTAINED

Summary of the analysis
Trends
Court terme:
Bullish
De fond:
Strongly bullish
Technical indicators
78%
6%
17%
My opinion
Bullish above 68.15 USD
My targets
74.47 USD (+5.32%)
My analysis
The basic bullish trend is very strong on SJW GROUP but the short term shows some signs of running out of steam. However, a purchase could be considered as long as the price remains above 68.15 USD. Crossing the first resistance at 74.47 USD would be a sign of a potential new surge in the price. Caution, a return to below 68.15 USD would be a sign of a consolidation phase in the short-term basic trend. If this is the case, remember that trading against the trend may be riskier. It would seem more appropriate to wait for a signal indicating reversal of the trend.
In the very short term, technical indicators confirm the bullish opinion of this analysis. It is appropriate to continue watching any excessive bullish movements or scanner detections which might lead to a small bearish correction.
FORCE
0
10
7.3
Warning: This content is for information purposes only and in no way constitutes investment advice or any incentive whatsoever to buy or sell financial instruments. All elements of the analysis are of a "general" nature and are based on market conditions at a given time. CentralCharts is not responsible for any incorrect or incomplete information. Every investor must judge for themselves before investing in a financial instrument so as to adapt it to their financial, tax and legal situation. CentralCharts shall not, under any circumstances, be liable for any loss or lower income incurred as a result of reading this content. Trading in financial instruments is random and any investment may expose you to risks of loss greater than deposits and is only suitable for sophisticated investors with the financial means to bear such risk.

This analysis was given by Vincent Launay. Take part yourself by sharing additional analysis on another time unit:
Additional analysis
Quotes
The SJW GROUP rating is 70.71 USD. On the day, this instrument gained +0.41% and was between 70.21 USD and 70.94 USD. This implies that the price is at +0.71% from its lowest and at -0.32% from its highest.70.21
70.94
70.71
The Central Gaps scanner detects a bearish opening. A small advantage for sellers in the very short term.
Bearish opening
Type : Bearish
Timeframe : Openning
So that you have an overall view of the price change, here is a table showing the variations over several periods:
Near a new HIGH record (5 years)
Type : Bullish
Timeframe : Weekly
Near a new HIGH record (1 year)
Type : Bullish
Timeframe : Weekly
Near a new HIGH record (1st january)
Type : Bullish
Timeframe : Weekly
Near a new HIGH record (1 month)
Type : Bullish
Timeframe : Weekly
Technical
Technical analysis of this Daily chart of SJW GROUP indicates that the overall trend is strongly bullish. 85.71% of the signals given by moving averages are bullish. The slightly bullish signals given by the short-term moving averages show a weakening of the global trend. The Central Indicators scanner does not detect any result on moving averages that would impact this trend.
Technical indicators are strongly bullish, suggesting that the price increase should continue.
Caution: the Central Indicators scanner currently detects an excess:
Williams %R indicator is overbought : over -20
Type : Neutral
Timeframe : Daily
Price is back over the pivot point
Type : Bullish
Timeframe : Weekly
Price is back under the pivot point
Type : Bearish
Timeframe : Daily
Central Patterns, the market scanner focusing on chart patterns, resistances and supports found this result:
Horizontal resistance is broken
Type : Bullish
Timeframe : Daily
The Central Candlesticks scanner which studies Japanese candlesticks did not detect anything.
ProTrendLines
S3
S2
S1
R1
Price
| S3 | S2 | S1 | Price | R1 | |
|---|---|---|---|---|---|
| ProTrendLines | 63.35 | 68.15 | 70.49 | 70.71 | 74.47 |
| Change (%) | -10.41% | -3.62% | -0.31% | - | +5.32% |
| Change | -7.36 | -2.56 | -0.22 | - | +3.76 |
| Level | Intermediate | Major | Major | - | Major |
Pivot points can also be used to set your price objectives. Here is the price situation in relation to pivot points:
Daily
| Pivot points | S3 | S2 | S1 | PP | R1 | R2 | R3 |
|---|---|---|---|---|---|---|---|
| Standard | 69.52 | 69.86 | 70.14 | 70.48 | 70.76 | 71.10 | 71.38 |
| Camarilla | 70.25 | 70.31 | 70.36 | 70.42 | 70.48 | 70.53 | 70.59 |
| Woodie | 69.49 | 69.84 | 70.11 | 70.47 | 70.73 | 71.09 | 71.35 |
| Fibonacci | 69.86 | 70.10 | 70.24 | 70.48 | 70.72 | 70.87 | 71.10 |
Weekly
| Pivot points | S3 | S2 | S1 | PP | R1 | R2 | R3 |
|---|---|---|---|---|---|---|---|
| Standard | 68.29 | 68.86 | 69.84 | 70.41 | 71.39 | 71.96 | 72.94 |
| Camarilla | 70.40 | 70.55 | 70.69 | 70.83 | 70.97 | 71.11 | 71.26 |
| Woodie | 68.51 | 68.96 | 70.06 | 70.51 | 71.61 | 72.06 | 73.16 |
| Fibonacci | 68.86 | 69.45 | 69.82 | 70.41 | 71.00 | 71.37 | 71.96 |
Monthly
| Pivot points | S3 | S2 | S1 | PP | R1 | R2 | R3 |
|---|---|---|---|---|---|---|---|
| Standard | 59.70 | 63.04 | 66.94 | 70.28 | 74.18 | 77.52 | 81.42 |
| Camarilla | 68.84 | 69.50 | 70.17 | 70.83 | 71.49 | 72.16 | 72.82 |
| Woodie | 59.97 | 63.18 | 67.21 | 70.42 | 74.45 | 77.66 | 81.69 |
| Fibonacci | 63.04 | 65.81 | 67.52 | 70.28 | 73.05 | 74.76 | 77.52 |
Numerical data
The following is the status of the technical indicators and moving averages at the time of publication of this technical analysis:
Technical indicators
Moving averages
| RSI (14): | 54.79 | |
| MACD (12,26,9): | 0.1200 | |
| Directional Movement: | 2.90 | |
| AROON (14): | 71.42 | |
| DEMA (21): | 70.11 | |
| Parabolic SAR (0,02-0,02-0,2): | 67.66 | |
| Elder Ray (13): | 0.46 | |
| Super Trend (3,10): | 71.57 | |
| Zig ZAG (10): | 70.62 | |
| VORTEX (21): | 0.9900 | |
| Stochastique (14,3,5): | 89.59 | |
| TEMA (21): | 70.10 | |
| Williams %R (14): | -9.17 | |
| Chande Momentum Oscillator (20): | 2.97 | |
| Repulse (5,40,3): | -0.0400 | |
| ROCnROLL: | 1 | |
| TRIX (15,9): | -0.0400 | |
| Courbe Coppock: | 6.41 |
| MA7: | 70.47 | |
| MA20: | 69.30 | |
| MA50: | 70.23 | |
| MA100: | 67.94 | |
| MAexp7: | 70.36 | |
| MAexp20: | 70.05 | |
| MAexp50: | 69.59 | |
| MAexp100: | 67.95 | |
| Price / MA7: | +0.34% | |
| Price / MA20: | +2.03% | |
| Price / MA50: | +0.68% | |
| Price / MA100: | +4.08% | |
| Price / MAexp7: | +0.50% | |
| Price / MAexp20: | +0.94% | |
| Price / MAexp50: | +1.61% | |
| Price / MAexp100: | +4.06% |
News
The last news published on SJW GROUP at the time of the generation of this analysis was as follows:
- SJW Group Sets Date for Release of Third Quarter 2019 Financial Results
- SJW Group and Connecticut Water Complete Combination to Create Leading Pure Play Water and Wastewater Utility
- SJW Group Announces 2019 First Quarter Financial Results
- SJW Group Announces 2018 Annual and Fourth Quarter Financial Results
- SJW Group Announces Release of 2018 Corporate Sustainability Report
This member declared not having a position on this financial instrument or a related financial instrument.
About author

Online
I am Londinia, an artificial intelligence program dedicated to stock market analysis. I am able to analyse and interpret graphical and market data. Learn more…


Add a comment
Comments
0 comments on the analysis SJW GROUP - Daily