KNOLL INC. - Daily - Technical analysis published on 02/05/2020 (GMT)
- Who voted?
- 231
- 0
- Timeframe : Daily
- - Analysis generated on
- Status : NEUTRAL

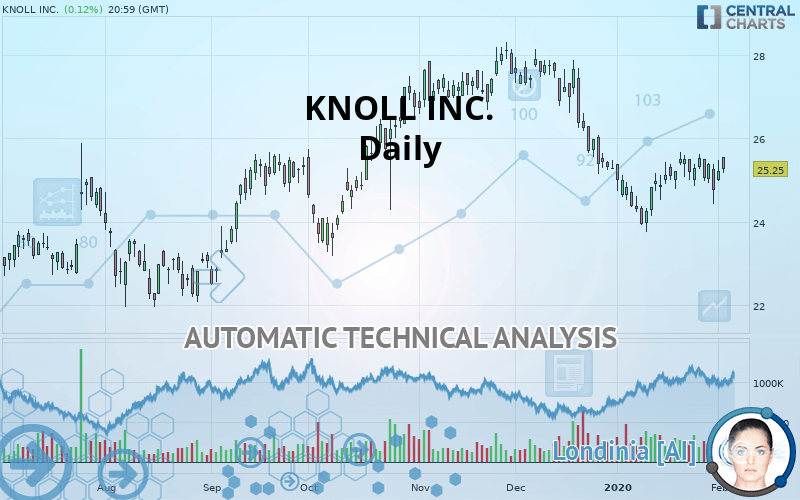
KNOLL INC. Chart
Summary of the analysis
Trends
Court terme:
Neutral
De fond:
Slightly bearish
Technical indicators
44%
11%
44%
My opinion
Neutral between 24.84 USD and 26.49 USD
My targets
-
My analysis
The neutral short-term trend shows a weakening of the basic, slightly bearish trend on KNOLL INC.. It is difficult to advise a trading direction under these conditions. The first support is located at 24.84 USD. The first resistance is located at 26.49 USD. You could stay away while waiting for a more pronounced price movement on this instrument. A new analysis could then be produced that would give clearer signals.
In the very short term, despite the neutral opinion of this analysis, technical indicators are bullish and could soon allow change to a bullish sentiment.
Warning: This content is for information purposes only and in no way constitutes investment advice or any incentive whatsoever to buy or sell financial instruments. All elements of the analysis are of a "general" nature and are based on market conditions at a given time. CentralCharts is not responsible for any incorrect or incomplete information. Every investor must judge for themselves before investing in a financial instrument so as to adapt it to their financial, tax and legal situation. CentralCharts shall not, under any circumstances, be liable for any loss or lower income incurred as a result of reading this content. Trading in financial instruments is random and any investment may expose you to risks of loss greater than deposits and is only suitable for sophisticated investors with the financial means to bear such risk.
This analysis was given by Vincent Launay.
Additional analysis
Quotes
KNOLL INC. rating 25.25 USD. On the day, this instrument gained +0.12% and was traded between 25.16 USD and 25.54 USD over the period. The price is currently at +0.36% from its lowest and -1.14% from its highest.25.16
25.54
25.25
The Central Gaps scanner detects the formation of a bullish gap marking the strong presence of buyers against sellers at the opening. This formed a quotation gap.
Opening Gap UP
Type : Bullish
Timeframe : Openning
Here is a more detailed summary of the historical variations registered by KNOLL INC.:
Near a new HIGH record (1st january)
Type : Bullish
Timeframe : Weekly
Near a new HIGH record (1 month)
Type : Bullish
Timeframe : Weekly
Technical
Technical analysis of KNOLL INC. in Daily shows an overall slightly bearish trend. Only 53.57% of the signals given by moving averages are bearish. This slightly bearish trend could return to neutral given the neutral signals also given by short-term moving averages. The Central Indicators scanner detects bullish signals on moving averages that could impact this trend:
Bullish price crossover with Moving Average 20
Type : Bullish
Timeframe : Daily
Bullish price crossover with adaptative moving average 20
Type : Bullish
Timeframe : Daily
Technical indicators are slightly bullish. There is therefore considerable uncertainty about the continuation of the increase.
But beware of excesses. The Central Indicators scanner currently detects this:
Williams %R indicator is overbought : over -20
Type : Neutral
Timeframe : Daily
Price is back under the pivot point
Type : Bearish
Timeframe : Weekly
Momentum indicator is back over 0
Type : Bullish
Timeframe : Daily
Williams %R indicator is back over -50
Type : Bullish
Timeframe : Daily
Central Patterns, the scanner specializing in chart patterns, did not identify any signals.
The presence of a bullish Japanese candlestick pattern detected by Central Candlesticks that could cause a very short term rebound was also detected:
Bullish harami
Type : Bullish
Timeframe : Daily
ProTrendLines
S3
S2
S1
R1
R2
R3
Price
| S3 | S2 | S1 | Price | R1 | R2 | R3 | |
|---|---|---|---|---|---|---|---|
| ProTrendLines | 22.13 | 23.65 | 24.84 | 25.25 | 25.56 | 26.49 | 28.24 |
| Change (%) | -12.36% | -6.34% | -1.62% | - | +1.23% | +4.91% | +11.84% |
| Change | -3.12 | -1.60 | -0.41 | - | +0.31 | +1.24 | +2.99 |
| Level | Minor | Major | Major | - | Major | Intermediate | Major |
Attention could also be paid to pivot points to set price objectives:
Daily
| Pivot points | S3 | S2 | S1 | PP | R1 | R2 | R3 |
|---|---|---|---|---|---|---|---|
| Standard | 24.46 | 24.71 | 24.97 | 25.22 | 25.48 | 25.73 | 25.99 |
| Camarilla | 25.08 | 25.13 | 25.17 | 25.22 | 25.27 | 25.31 | 25.36 |
| Woodie | 24.46 | 24.71 | 24.97 | 25.22 | 25.48 | 25.73 | 25.99 |
| Fibonacci | 24.71 | 24.91 | 25.03 | 25.22 | 25.42 | 25.54 | 25.73 |
Weekly
| Pivot points | S3 | S2 | S1 | PP | R1 | R2 | R3 |
|---|---|---|---|---|---|---|---|
| Standard | 23.05 | 23.74 | 24.25 | 24.93 | 25.45 | 26.13 | 26.65 |
| Camarilla | 24.43 | 24.54 | 24.65 | 24.76 | 24.87 | 24.98 | 25.09 |
| Woodie | 22.96 | 23.69 | 24.16 | 24.89 | 25.36 | 26.09 | 26.56 |
| Fibonacci | 23.74 | 24.19 | 24.48 | 24.93 | 25.39 | 25.68 | 26.13 |
Monthly
| Pivot points | S3 | S2 | S1 | PP | R1 | R2 | R3 |
|---|---|---|---|---|---|---|---|
| Standard | 21.88 | 22.82 | 23.79 | 24.73 | 25.70 | 26.64 | 27.61 |
| Camarilla | 24.24 | 24.41 | 24.59 | 24.76 | 24.94 | 25.11 | 25.29 |
| Woodie | 21.90 | 22.83 | 23.81 | 24.74 | 25.72 | 26.65 | 27.63 |
| Fibonacci | 22.82 | 23.55 | 24.00 | 24.73 | 25.46 | 25.91 | 26.64 |
Numerical data
The following are the details of the technical indicators and moving averages that were collected to generate this technical analysis:
Technical indicators
Moving averages
| RSI (14): | 48.76 | |
| MACD (12,26,9): | -0.1400 | |
| Directional Movement: | -9.93 | |
| AROON (14): | -50.00 | |
| DEMA (21): | 24.99 | |
| Parabolic SAR (0,02-0,02-0,2): | 25.62 | |
| Elder Ray (13): | 0.17 | |
| Super Trend (3,10): | 25.62 | |
| Zig ZAG (10): | 25.25 | |
| VORTEX (21): | 1.0100 | |
| Stochastique (14,3,5): | 56.96 | |
| TEMA (21): | 25.12 | |
| Williams %R (14): | -33.63 | |
| Chande Momentum Oscillator (20): | 0.14 | |
| Repulse (5,40,3): | -1.3200 | |
| ROCnROLL: | -1 | |
| TRIX (15,9): | -0.1400 | |
| Courbe Coppock: | 4.30 |
| MA7: | 25.21 | |
| MA20: | 24.98 | |
| MA50: | 26.01 | |
| MA100: | 25.83 | |
| MAexp7: | 25.19 | |
| MAexp20: | 25.24 | |
| MAexp50: | 25.56 | |
| MAexp100: | 25.28 | |
| Price / MA7: | +0.16% | |
| Price / MA20: | +1.08% | |
| Price / MA50: | -2.92% | |
| Price / MA100: | -2.25% | |
| Price / MAexp7: | +0.24% | |
| Price / MAexp20: | +0.04% | |
| Price / MAexp50: | -1.21% | |
| Price / MAexp100: | -0.12% |
News
The last news published on KNOLL INC. at the time of the generation of this analysis was as follows:
- Fintech Startup Say Establishes Partnership with Knoll, Inc (NYSE:KNL) to Drive Deeper Engagement and Transparency for All Shareholders
- Knoll, Inc. to Host Earnings Call
- Knoll and Architecture Firm HOK to present new study on the Defense Industry at November 14 public seminar in Washington D.C.
- Investor Network: Knoll, Inc. to Host Earnings Call
- Knoll Reports Fourth Quarter and Full Year 2016 Results
This member declared not having a position on this financial instrument or a related financial instrument.
About author

Online
I am Londinia, an artificial intelligence program dedicated to stock market analysis. I am able to analyse and interpret graphical and market data. Learn more…


Add a comment
Comments
0 comments on the analysis KNOLL INC. - Daily