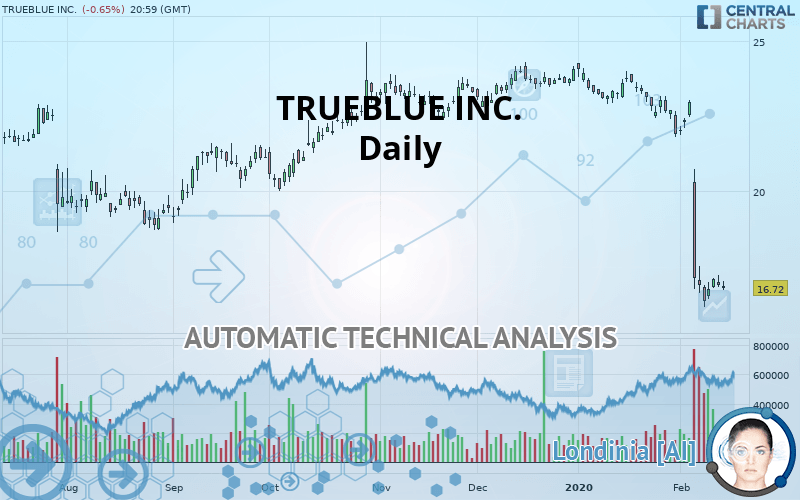
TRUEBLUE INC. - Daily - Technical analysis published on 02/18/2020 (GMT)
- Who voted?
- 218
- 0
Click here for a new analysis!
- Timeframe : Daily
- - Analysis generated on
- Status : TARGET REACHED

Summary of the analysis

Additional analysis
Quotes
The TRUEBLUE INC. rating is 16.72 USD. The price registered an increase of -0.65% on the session and was between 16.67 USD and 16.97 USD. This implies that the price is at +0.30% from its lowest and at -1.47% from its highest.The Central Gaps scanner detects a bearish opening. A small advantage for sellers in the very short term.
Bearish opening
Type : Bearish
Timeframe : Openning
A study of price movements over other periods shows the following variations:
New LOW record (5 years)
Type : Bearish
Timeframe : Weekly
Near a new LOW record (1 year)
Type : Bearish
Timeframe : Weekly
Near a new LOW record (1st january)
Type : Bearish
Timeframe : Weekly
Near a new LOW record (1 month)
Type : Bearish
Timeframe : Weekly
Technical
Technical analysis of TRUEBLUE INC. in Daily shows a overall strongly bearish trend. 89.29% of the signals given by moving averages are bearish. This strongly bearish trend is supported by the strong bearish signals given by short-term moving averages. There is no crossing of moving average by the price or crossing of moving averages between themselves.
In fact, 12 technical indicators on 18 studied are currently bearish. Caution: the Central Indicators scanner currently detects an excess:
RSI indicator is oversold : under 30
Type : Neutral
Timeframe : Daily
CCI indicator is oversold : under -100
Type : Neutral
Timeframe : Daily
Williams %R indicator is oversold : under -80
Type : Neutral
Timeframe : Daily
Price is back under the pivot point
Type : Bearish
Timeframe : Daily
Price is back under the pivot point
Type : Bearish
Timeframe : Weekly
No signals are given by Central Patterns, a market scanner specialised in chart patterns, resistances and supports.
For a small setback in the very short term, the Central Candlesticks scanner currently notes the presence of this bearish pattern in Japanese candlesticks:
Bearish harami
Type : Bearish
Timeframe : Daily
| S2 | S1 | Price | R1 | R2 | R3 | |
|---|---|---|---|---|---|---|
| ProTrendLines | 6.02 | 12.89 | 16.72 | 16.75 | 19.06 | 20.95 |
| Change (%) | -64.00% | -22.91% | - | +0.18% | +14.00% | +25.30% |
| Change | -10.70 | -3.83 | - | +0.03 | +2.34 | +4.23 |
| Level | Minor | Minor | - | Major | Major | Intermediate |
Pivot points can also be used to set your price objectives. Here is the price situation in relation to pivot points:
| Pivot points | S3 | S2 | S1 | PP | R1 | R2 | R3 |
|---|---|---|---|---|---|---|---|
| Standard | 16.29 | 16.53 | 16.68 | 16.92 | 17.07 | 17.31 | 17.46 |
| Camarilla | 16.72 | 16.76 | 16.79 | 16.83 | 16.87 | 16.90 | 16.94 |
| Woodie | 16.25 | 16.51 | 16.64 | 16.90 | 17.03 | 17.29 | 17.42 |
| Fibonacci | 16.53 | 16.68 | 16.77 | 16.92 | 17.07 | 17.16 | 17.31 |
| Pivot points | S3 | S2 | S1 | PP | R1 | R2 | R3 |
|---|---|---|---|---|---|---|---|
| Standard | 8.12 | 12.34 | 14.59 | 18.81 | 21.06 | 25.28 | 27.53 |
| Camarilla | 15.05 | 15.64 | 16.24 | 16.83 | 17.42 | 18.02 | 18.61 |
| Woodie | 7.13 | 11.85 | 13.60 | 18.32 | 20.07 | 24.79 | 26.54 |
| Fibonacci | 12.34 | 14.82 | 16.34 | 18.81 | 21.29 | 22.81 | 25.28 |
| Pivot points | S3 | S2 | S1 | PP | R1 | R2 | R3 |
|---|---|---|---|---|---|---|---|
| Standard | 18.61 | 20.21 | 21.06 | 22.66 | 23.51 | 25.11 | 25.96 |
| Camarilla | 21.24 | 21.46 | 21.69 | 21.91 | 22.14 | 22.36 | 22.58 |
| Woodie | 18.24 | 20.02 | 20.69 | 22.47 | 23.14 | 24.92 | 25.59 |
| Fibonacci | 20.21 | 21.15 | 21.72 | 22.66 | 23.60 | 24.17 | 25.11 |
Numerical data
The following is the status of technical indicators and moving averages registered at the time this technical analysis was created:
| RSI (14): | 22.78 | |
| MACD (12,26,9): | -1.7800 | |
| Directional Movement: | -37.94 | |
| AROON (14): | -64.29 | |
| DEMA (21): | 17.75 | |
| Parabolic SAR (0,02-0,02-0,2): | 19.10 | |
| Elder Ray (13): | -1.99 | |
| Super Trend (3,10): | 19.21 | |
| Zig ZAG (10): | 16.72 | |
| VORTEX (21): | 0.6500 | |
| Stochastique (14,3,5): | 10.80 | |
| TEMA (21): | 16.45 | |
| Williams %R (14): | -91.23 | |
| Chande Momentum Oscillator (20): | -5.94 | |
| Repulse (5,40,3): | -3.8900 | |
| ROCnROLL: | 2 | |
| TRIX (15,9): | -0.7800 | |
| Courbe Coppock: | 49.03 |
| MA7: | 16.78 | |
| MA20: | 20.71 | |
| MA50: | 22.43 | |
| MA100: | 22.38 | |
| MAexp7: | 17.55 | |
| MAexp20: | 19.82 | |
| MAexp50: | 21.51 | |
| MAexp100: | 21.98 | |
| Price / MA7: | -0.36% | |
| Price / MA20: | -19.27% | |
| Price / MA50: | -25.46% | |
| Price / MA100: | -25.29% | |
| Price / MAexp7: | -4.73% | |
| Price / MAexp20: | -15.64% | |
| Price / MAexp50: | -22.27% | |
| Price / MAexp100: | -23.93% |
News
The last news published on TRUEBLUE INC. at the time of the generation of this analysis was as follows:
- TrueBlue Reports Fourth Quarter and Full-Year 2019 Results
- TrueBlue to Announce Fourth Quarter 2019 Results
- HRO Today Names Four TrueBlue Leaders as 2019 HR Superstars
- Shortages of Low-Skill, Middle-Skill, and High-Skill Workers Causing Revenue Declines and Other Headaches for Employers, TrueBlue’s Latest Study Finds
- TrueBlue to Announce Third Quarter 2019 Results
About author

Online


Add a comment
Comments
0 comments on the analysis TRUEBLUE INC. - Daily