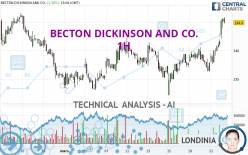
BECTON DICKINSON AND CO. - 1H - Technical analysis published on 03/22/2024 (GMT)
- 87
- 0
Click here for a new analysis!
- Timeframe : 1H
- - Analysis generated on
- Status : INVALID
Summary of the analysis

Additional analysis
Quotes
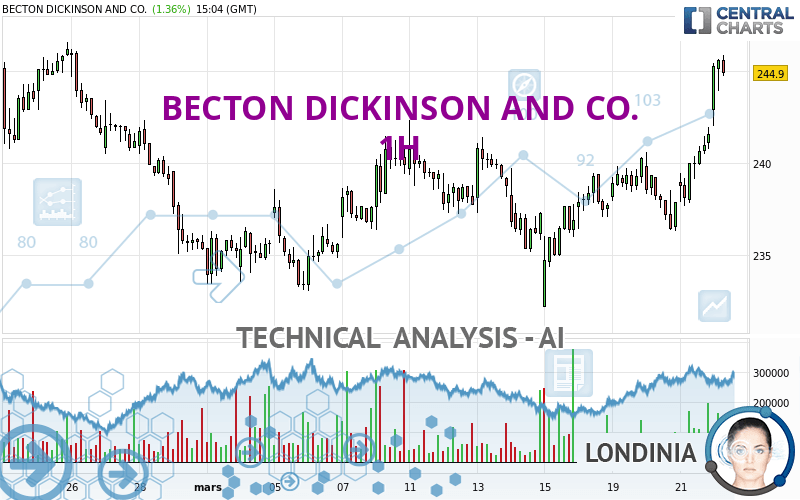
The BECTON DICKINSON AND CO. rating is 245.82 USD. The price has increased by +1.74% since the last closing with the lowest point at 242.05 USD and the highest point at 245.90 USD. The deviation from the price is +1.56% for the low point and -0.03% for the high point.The Central Gaps scanner detects the formation of a bullish gap marking the strong presence of buyers against sellers at the opening. This formed a quotation gap.
Opening Gap UP
Type : Bullish
Timeframe : Openning
Here is a more detailed summary of the historical variations registered by BECTON DICKINSON AND CO.:
Near a new LOW record (1st january)
Type : Bearish
Timeframe : Weekly
Near a new LOW record (1 month)
Type : Bearish
Timeframe : Weekly
Technical
Technical analysis of BECTON DICKINSON AND CO. in 1H shows a strongly overall bullish trend. 92.86% of the signals given by moving averages are bullish. The overall trend is supported by the strong bullish signals from short-term moving averages. The Central Indicators market scanner currently does not detect any result that concerns moving averages.
An assessment of technical indicators shows a strong bullish signal.
But beware of excesses. The Central Indicators scanner currently detects this:
RSI indicator is overbought : over 70
Type : Neutral
Timeframe : 1 hour
CCI indicator is overbought : over 100
Type : Neutral
Timeframe : 1 hour
Previous candle closed over Bollinger bands
Type : Neutral
Timeframe : 1 hour
Williams %R indicator is overbought : over -20
Type : Neutral
Timeframe : 1 hour
Pivot points : price is over resistance 1
Type : Neutral
Timeframe : Weekly
Pivot points : price is over resistance 2
Type : Neutral
Timeframe : 1 hour
Central Patterns, the market scanner focusing on chart patterns, resistances and supports found this result:
Resistance of channel is broken
Type : Bullish
Timeframe : 1 hour
The Central Candlesticks scanner currently notes the presence of this pattern in Japanese candlesticks that could mark the end of the short-term trend currently underway:
Doji
Type : Neutral
Timeframe : 1 hour
| S3 | S2 | S1 | Price | R1 | R2 | R3 | |
|---|---|---|---|---|---|---|---|
| ProTrendLines | 237.28 | 239.82 | 242.38 | 245.82 | 246.02 | 255.44 | 262.04 |
| Change (%) | -3.47% | -2.44% | -1.40% | - | +0.08% | +3.91% | +6.60% |
| Change | -8.54 | -6.00 | -3.44 | - | +0.20 | +9.62 | +16.22 |
| Level | Minor | Intermediate | Minor | - | Major | Minor | Intermediate |
To determine price objectives, it is also possible to use the pivot points. Here is the price position in relation to pivot points:
| Pivot points | S3 | S2 | S1 | PP | R1 | R2 | R3 |
|---|---|---|---|---|---|---|---|
| Standard | 234.59 | 236.14 | 238.88 | 240.43 | 243.17 | 244.72 | 247.46 |
| Camarilla | 240.44 | 240.83 | 241.23 | 241.62 | 242.01 | 242.41 | 242.80 |
| Woodie | 235.19 | 236.44 | 239.48 | 240.73 | 243.77 | 245.02 | 248.06 |
| Fibonacci | 236.14 | 237.78 | 238.79 | 240.43 | 242.07 | 243.08 | 244.72 |
| Pivot points | S3 | S2 | S1 | PP | R1 | R2 | R3 |
|---|---|---|---|---|---|---|---|
| Standard | 221.60 | 226.89 | 231.80 | 237.09 | 242.00 | 247.29 | 252.20 |
| Camarilla | 233.91 | 234.84 | 235.78 | 236.71 | 237.65 | 238.58 | 239.52 |
| Woodie | 221.41 | 226.80 | 231.61 | 237.00 | 241.81 | 247.20 | 252.01 |
| Fibonacci | 226.89 | 230.79 | 233.19 | 237.09 | 240.99 | 243.39 | 247.29 |
| Pivot points | S3 | S2 | S1 | PP | R1 | R2 | R3 |
|---|---|---|---|---|---|---|---|
| Standard | 215.92 | 224.06 | 229.33 | 237.47 | 242.74 | 250.88 | 256.15 |
| Camarilla | 230.91 | 232.14 | 233.37 | 234.60 | 235.83 | 237.06 | 238.29 |
| Woodie | 214.49 | 223.34 | 227.90 | 236.75 | 241.31 | 250.16 | 254.72 |
| Fibonacci | 224.06 | 229.18 | 232.35 | 237.47 | 242.59 | 245.76 | 250.88 |
Numerical data
The following are the details of the technical indicators and moving averages that were collected to generate this technical analysis:
| RSI (14): | 72.45 | |
| MACD (12,26,9): | 1.3700 | |
| Directional Movement: | 25.19 | |
| AROON (14): | 57.15 | |
| DEMA (21): | 241.82 | |
| Parabolic SAR (0,02-0,02-0,2): | 239.11 | |
| Elder Ray (13): | 3.59 | |
| Super Trend (3,10): | 239.92 | |
| Zig ZAG (10): | 245.57 | |
| VORTEX (21): | 1.1500 | |
| Stochastique (14,3,5): | 95.59 | |
| TEMA (21): | 242.88 | |
| Williams %R (14): | -4.56 | |
| Chande Momentum Oscillator (20): | 7.22 | |
| Repulse (5,40,3): | 1.4900 | |
| ROCnROLL: | 1 | |
| TRIX (15,9): | 0.0400 | |
| Courbe Coppock: | 2.71 |
| MA7: | 239.60 | |
| MA20: | 238.00 | |
| MA50: | 237.84 | |
| MA100: | 238.59 | |
| MAexp7: | 243.34 | |
| MAexp20: | 240.27 | |
| MAexp50: | 239.04 | |
| MAexp100: | 238.56 | |
| Price / MA7: | +2.60% | |
| Price / MA20: | +3.29% | |
| Price / MA50: | +3.36% | |
| Price / MA100: | +3.03% | |
| Price / MAexp7: | +1.02% | |
| Price / MAexp20: | +2.31% | |
| Price / MAexp50: | +2.84% | |
| Price / MAexp100: | +3.04% |
News
The last news published on BECTON DICKINSON AND CO. at the time of the generation of this analysis was as follows:
- BD to Present at Investor Healthcare Conferences
- BD Announces Exercise of Option to Purchase Additional Shares by Underwriters of Public Equity Offerings Increasing Total Gross Proceeds to $4.95 Billion
- BD Prices Offerings of $2.25 Billion of Common Stock and $2.25 Billion of Depositary Shares Representing Interests in Mandatory Convertible Preferred Stock
- BD and UniteOR Join Forces to Deliver an Integrated Tracking Solution for the Operating Room Setting
- BD Announces Offerings of $2.25 Billion of Common Stock and $2.25 Billion of Depositary Shares Representing Interests in Mandatory Convertible Preferred Stock
About author
Online


Add a comment
Comments
0 comments on the analysis BECTON DICKINSON AND CO. - 1H