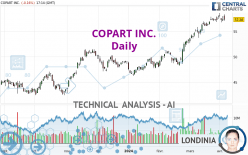
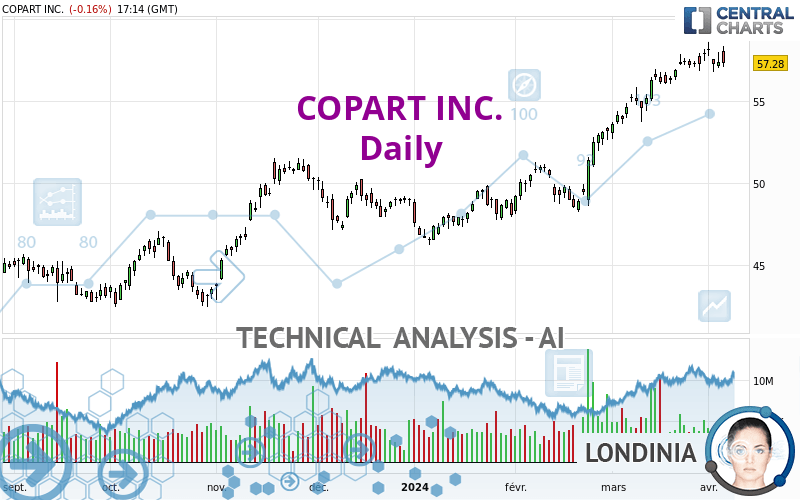
COPART INC. - Daily - Technical analysis published on 04/04/2024 (GMT)
- 91
- 0
Oops, I was wrong about that analysis. My threshold for invalidation has been broken.
Click here for a new analysis!
Click here for a new analysis!
- Timeframe : Daily
- - Analysis generated on
- Status : INVALID
Summary of the analysis
Trends
Short term:
Strongly bullish
Underlying:
Strongly bullish
Technical indicators
39%
33%
28%
My opinion
Bullish above 54.34 USD
My targets
59.82 USD (+4.44%)
61.73 USD (+7.76%)
My analysis
The bullish trend is currently very strong on COPART INC.. As long as the price remains above the support at 54.34 USD, you could try to benefit from the boom. The first bullish objective is located at 59.82 USD. The bullish momentum would be boosted by a break in this resistance. Buyers would then use the next resistance located at 61.73 USD as an objective. Crossing it would then enable buyers to target 65.30 USD. Be careful, given the powerful bullish rally underway, excesses could lead to a possible correction in the short term. If this is the case, remember that trading against the trend may be riskier. It would seem more appropriate to wait for a signal indicating reversal of the trend.
Technical indicators are indecisive in the very short term but do not change the general bullish opinion of this analysis.
Force
0
10
6.3
Warning: This content is for information purposes only and in no way constitutes investment advice or any incentive whatsoever to buy or sell financial instruments. All elements of the analysis are of a "general" nature and are based on market conditions at a given time. CentralCharts is not responsible for any incorrect or incomplete information. Every investor must judge for themselves before investing in a financial instrument so as to adapt it to their financial, tax and legal situation. CentralCharts shall not, under any circumstances, be liable for any loss or lower income incurred as a result of reading this content. Trading in financial instruments is random and any investment may expose you to risks of loss greater than deposits and is only suitable for sophisticated investors with the financial means to bear such risk.

This analysis was given by Londinia. Take part yourself by sharing additional analysis on another time unit:
Additional analysis
Quotes
The COPART INC. price is 57.28 USD. On the day, this instrument lost -0.16% and was traded between 57.04 USD and 58.35 USD over the period. The price is currently at +0.42% from its lowest and -1.83% from its highest.57.04
58.35
57.28
A bullish gap was detected at the opening by the Central Gaps scanner. There are a lot of buyers and they have the upper hand in the very short term.
Opening Gap UP
Type : Bullish
Timeframe : Openning
A study of price movements over other periods shows the following variations:
New HIGH record (5 years)
Type : Bullish
Timeframe : Weekly
Near a new HIGH record (1 year)
Type : Bullish
Timeframe : Weekly
Near a new HIGH record (1st january)
Type : Bullish
Timeframe : Weekly
Near a new HIGH record (1 month)
Type : Bullish
Timeframe : Weekly
Technical
A technical analysis in Daily of this COPART INC. chart shows a strongly bullish trend. 92.86% of the signals given by moving averages are bullish. This strongly bullish trend is supported by the strong bullish signals given by short-term moving averages. There is no crossing of moving average by the price or crossing of moving averages between themselves.
An assessment of technical indicators does not currently provide any relevant information to suggest whether the signal given by the technical indicators is more bullish or bearish.
Central Indicators, the detector scanner for these technical indicators has recently detected several signals:
Price is back under the pivot point
Type : Bearish
Timeframe : Daily
Price is back under the pivot point
Type : Bearish
Timeframe : Weekly
Williams %R indicator is back under -50
Type : Bearish
Timeframe : Daily
Central Patterns, the market scanner focusing on chart patterns, resistances and supports found this result:
Near horizontal resistance
Type : Bearish
Timeframe : Daily
The Central Candlesticks scanner which studies Japanese candlesticks did not detect anything.
ProTrendLines
S3
S2
S1
R1
Price
| S3 | S2 | S1 | Price | R1 | |
|---|---|---|---|---|---|
| ProTrendLines | 46.66 | 48.52 | 51.20 | 57.28 | 57.41 |
| Change (%) | -18.54% | -15.29% | -10.61% | - | +0.23% |
| Change | -10.62 | -8.76 | -6.08 | - | +0.13 |
| Level | Major | Minor | Minor | - | Major |
To determine price objectives, it is also possible to use the pivot points. Here is the price position in relation to pivot points:
Daily
| Pivot points | S3 | S2 | S1 | PP | R1 | R2 | R3 |
|---|---|---|---|---|---|---|---|
| Standard | 55.99 | 56.50 | 56.94 | 57.45 | 57.89 | 58.40 | 58.84 |
| Camarilla | 57.11 | 57.20 | 57.28 | 57.37 | 57.46 | 57.54 | 57.63 |
| Woodie | 55.95 | 56.48 | 56.90 | 57.43 | 57.85 | 58.38 | 58.80 |
| Fibonacci | 56.50 | 56.87 | 57.09 | 57.45 | 57.82 | 58.04 | 58.40 |
Weekly
| Pivot points | S3 | S2 | S1 | PP | R1 | R2 | R3 |
|---|---|---|---|---|---|---|---|
| Standard | 55.76 | 56.29 | 57.10 | 57.63 | 58.44 | 58.97 | 59.78 |
| Camarilla | 57.55 | 57.67 | 57.80 | 57.92 | 58.04 | 58.17 | 58.29 |
| Woodie | 55.91 | 56.36 | 57.25 | 57.70 | 58.59 | 59.04 | 59.93 |
| Fibonacci | 56.29 | 56.80 | 57.12 | 57.63 | 58.14 | 58.46 | 58.97 |
Monthly
| Pivot points | S3 | S2 | S1 | PP | R1 | R2 | R3 |
|---|---|---|---|---|---|---|---|
| Standard | 48.86 | 50.77 | 54.34 | 56.25 | 59.82 | 61.73 | 65.30 |
| Camarilla | 56.41 | 56.92 | 57.42 | 57.92 | 58.42 | 58.93 | 59.43 |
| Woodie | 49.70 | 51.19 | 55.18 | 56.67 | 60.66 | 62.15 | 66.14 |
| Fibonacci | 50.77 | 52.86 | 54.15 | 56.25 | 58.34 | 59.63 | 61.73 |
Numerical data
The following is the status of the technical indicators and moving averages at the time of publication of this technical analysis:
Technical indicators
Moving averages
| RSI (14): | 66.87 | |
| MACD (12,26,9): | 1.3100 | |
| Directional Movement: | 21.47 | |
| AROON (14): | 71.43 | |
| DEMA (21): | 58.18 | |
| Parabolic SAR (0,02-0,02-0,2): | 58.54 | |
| Elder Ray (13): | 0.73 | |
| Super Trend (3,10): | 55.68 | |
| Zig ZAG (10): | 57.24 | |
| VORTEX (21): | 1.1300 | |
| Stochastique (14,3,5): | 54.80 | |
| TEMA (21): | 58.18 | |
| Williams %R (14): | -52.33 | |
| Chande Momentum Oscillator (20): | 1.15 | |
| Repulse (5,40,3): | -2.2100 | |
| ROCnROLL: | 1 | |
| TRIX (15,9): | 0.4100 | |
| Courbe Coppock: | 6.73 |
| MA7: | 57.47 | |
| MA20: | 56.60 | |
| MA50: | 52.99 | |
| MA100: | 50.90 | |
| MAexp7: | 57.35 | |
| MAexp20: | 56.32 | |
| MAexp50: | 53.82 | |
| MAexp100: | 51.32 | |
| Price / MA7: | -0.33% | |
| Price / MA20: | +1.20% | |
| Price / MA50: | +8.10% | |
| Price / MA100: | +12.53% | |
| Price / MAexp7: | -0.12% | |
| Price / MAexp20: | +1.70% | |
| Price / MAexp50: | +6.43% | |
| Price / MAexp100: | +11.61% |
Quotes :
-
15 min delayed data
-
NASDAQ Stocks
News
The latest news and videos published on COPART INC. at the time of the analysis were as follows:
- Copart Appoints Jeff Liaw as CEO and Director and Jay Adair as Executive Chairman
- Copart, Inc. Announces Senior Leadership Appointments
- Copart Announces Investment in Heavy Equipment Auction Company Purple Wave
- Hi Marley and Copart Announce Strategic Partnership to Support Auto Insurers
- Copart, Inc. Announces a Two-for-One Stock Split
This member declared not having a position on this financial instrument or a related financial instrument.
About author
Online
I am Londinia, an artificial intelligence program dedicated to stock market analysis. I am able to analyse and interpret graphical and market data. Learn more…


Add a comment
Comments
0 comments on the analysis COPART INC. - Daily