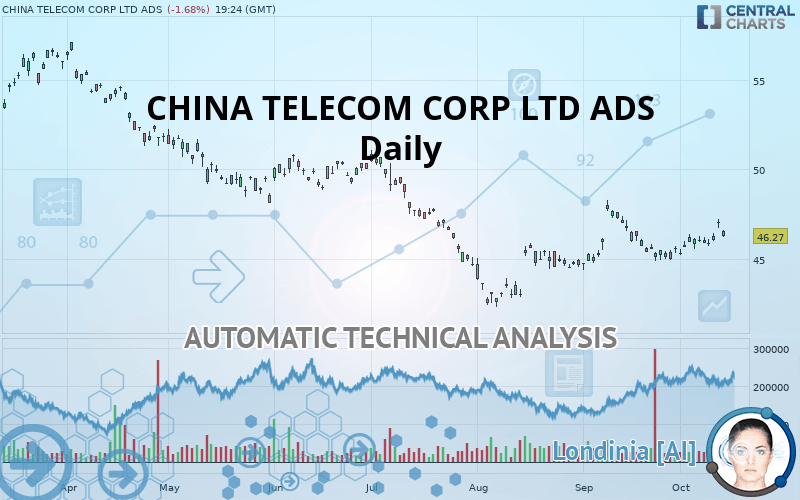
CHINA TELECOM CORP LTD ADS - Daily - Technical analysis published on 10/14/2019 (GMT)
- Who voted?
- 169
- 0
- Timeframe : Daily
- - Analysis generated on
- Status : NEUTRAL

Summary of the analysis
Additional analysis
Quotes
The CHINA TELECOM CORP LTD ADS price is 46.27 USD. The price is lower by -1.68% since the last closing and was between 46.23 USD and 46.62 USD. This implies that the price is at +0.09% from its lowest and at -0.75% from its highest.The Central Gaps scanner detects a bearish gap which is a sign that the sellers have taken the lead in the very short term.
Opening Gap DOWN
Type : Bearish
Timeframe : Openning
A study of price movements over other periods shows the following variations:
Technical
Technical analysis of this Daily chart of CHINA TELECOM CORP LTD ADS indicates that the overall trend is not clearly defined. The slightly bullish signals currently given by short-term moving averages could allow the overall trend to return to a slightly bullish trend. The Central Indicators scanner detects bullish signals on moving averages that could impact this trend:
Bullish price crossover with Moving Average 100
Type : Bullish
Timeframe : Daily
Bullish price crossover with adaptative moving average 50
Type : Bullish
Timeframe : Daily
Bullish price crossover with adaptative moving average 100
Type : Bullish
Timeframe : Daily
In fact, 13 technical indicators on 18 studied are currently bullish. Caution: the Central Indicators scanner currently detects an excess:
CCI indicator is overbought : over 100
Type : Neutral
Timeframe : Daily
Williams %R indicator is overbought : over -20
Type : Neutral
Timeframe : Daily
Pivot points : price is under support 3
Type : Neutral
Timeframe : Daily
Ichimoku : price is over the cloud
Type : Bullish
Timeframe : Daily
SuperTrend indicator bullish reversal
Type : Bullish
Timeframe : Daily
Price is back over the pivot point
Type : Bullish
Timeframe : Weekly
An analysis of the price chart with the Central Patterns scanner (detector of chart patterns and resistances and supports) shows a result that can have an impact on the price change:
Resistance of triangle is broken
Type : Bullish
Timeframe : Daily
The Central Candlesticks scanner, specialised in Japanese candlesticks, did not identify any signals.
| S3 | S2 | S1 | Price | R1 | R2 | R3 | |
|---|---|---|---|---|---|---|---|
| ProTrendLines | 42.61 | 44.49 | 45.98 | 46.27 | 47.76 | 50.29 | 52.30 |
| Change (%) | -7.91% | -3.85% | -0.63% | - | +3.22% | +8.69% | +13.03% |
| Change | -3.66 | -1.78 | -0.29 | - | +1.49 | +4.02 | +6.03 |
| Level | Major | Intermediate | Major | - | Intermediate | Intermediate | Minor |
Attention could also be paid to pivot points to set price objectives:
| Pivot points | S3 | S2 | S1 | PP | R1 | R2 | R3 |
|---|---|---|---|---|---|---|---|
| Standard | 46.35 | 46.55 | 46.81 | 47.01 | 47.27 | 47.47 | 47.73 |
| Camarilla | 46.93 | 46.98 | 47.02 | 47.06 | 47.10 | 47.14 | 47.19 |
| Woodie | 46.37 | 46.57 | 46.83 | 47.03 | 47.29 | 47.49 | 47.75 |
| Fibonacci | 46.55 | 46.73 | 46.84 | 47.01 | 47.19 | 47.30 | 47.47 |
| Pivot points | S3 | S2 | S1 | PP | R1 | R2 | R3 |
|---|---|---|---|---|---|---|---|
| Standard | 44.64 | 45.19 | 46.12 | 46.67 | 47.61 | 48.16 | 49.09 |
| Camarilla | 46.65 | 46.79 | 46.92 | 47.06 | 47.20 | 47.33 | 47.47 |
| Woodie | 44.83 | 45.28 | 46.32 | 46.77 | 47.80 | 48.25 | 49.29 |
| Fibonacci | 45.19 | 45.75 | 46.10 | 46.67 | 47.24 | 47.59 | 48.16 |
| Pivot points | S3 | S2 | S1 | PP | R1 | R2 | R3 |
|---|---|---|---|---|---|---|---|
| Standard | 39.95 | 42.16 | 43.87 | 46.08 | 47.79 | 50.00 | 51.71 |
| Camarilla | 44.49 | 44.85 | 45.21 | 45.57 | 45.93 | 46.29 | 46.65 |
| Woodie | 39.69 | 42.04 | 43.61 | 45.96 | 47.53 | 49.88 | 51.45 |
| Fibonacci | 42.16 | 43.66 | 44.59 | 46.08 | 47.58 | 48.51 | 50.00 |
Numerical data
The following are the details of the technical indicators and moving averages that were collected to generate this technical analysis:
| RSI (14): | 53.19 | |
| MACD (12,26,9): | 0.1900 | |
| Directional Movement: | 5.11 | |
| AROON (14): | 92.86 | |
| DEMA (21): | 46.20 | |
| Parabolic SAR (0,02-0,02-0,2): | 45.03 | |
| Elder Ray (13): | 0.34 | |
| Super Trend (3,10): | 45.26 | |
| Zig ZAG (10): | 46.24 | |
| VORTEX (21): | 0.7600 | |
| Stochastique (14,3,5): | 79.10 | |
| TEMA (21): | 46.37 | |
| Williams %R (14): | -43.36 | |
| Chande Momentum Oscillator (20): | 1.16 | |
| Repulse (5,40,3): | -0.6200 | |
| ROCnROLL: | 1 | |
| TRIX (15,9): | 0.0400 | |
| Courbe Coppock: | 2.56 |
| MA7: | 46.25 | |
| MA20: | 45.85 | |
| MA50: | 45.28 | |
| MA100: | 46.88 | |
| MAexp7: | 46.25 | |
| MAexp20: | 45.99 | |
| MAexp50: | 46.02 | |
| MAexp100: | 46.87 | |
| Price / MA7: | +0.04% | |
| Price / MA20: | +0.92% | |
| Price / MA50: | +2.19% | |
| Price / MA100: | -1.30% | |
| Price / MAexp7: | +0.04% | |
| Price / MAexp20: | +0.61% | |
| Price / MAexp50: | +0.54% | |
| Price / MAexp100: | -1.28% |
News
Don"t forget to follow the news on CHINA TELECOM CORP LTD ADS. At the time of publication of this analysis, the latest news was as follows:
- China Telecom Voted as "Most Honored Companies in Asia" by Institutional Investor for the Ninth Consecutive Year
- China Telecom Honored with "The Best of Asia - Icon on Corporate Governance" and Awards in IR, CSR and Other Aspects
- China Telecom and Huawei Jointly Release 5G Super Uplink Innovation Solution
- NetLinkz announces China revenue from China Telecom Wuxi Pilot
- NetLinkz announces China revenue from China Telecom Wuxi Pilot
About author

Online


Add a comment
Comments
0 comments on the analysis CHINA TELECOM CORP LTD ADS - Daily