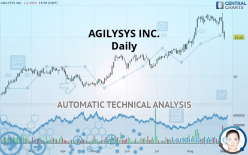
AGILYSYS INC. - Daily - Technical analysis published on 09/05/2019 (GMT)
- Who voted?
- 229
- 0
- Timeframe : Daily
- - Analysis generated on
- Status : NEUTRAL
Summary of the analysis

Additional analysis
Quotes
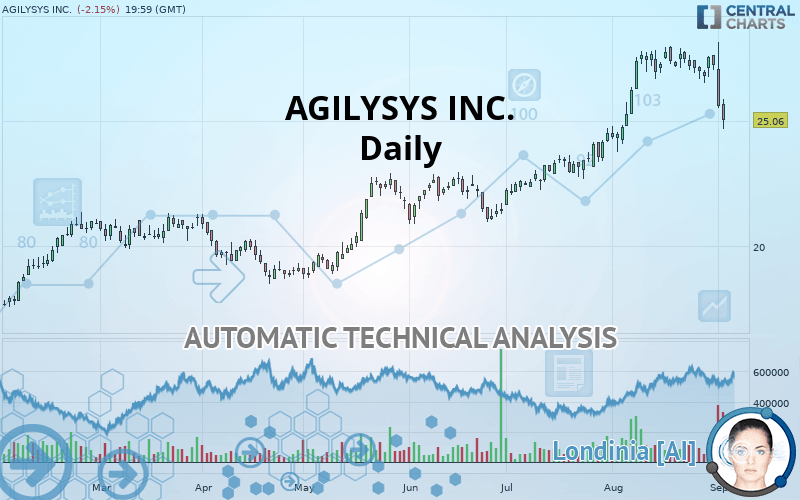
AGILYSYS INC. rating 25.06 USD. The price registered a decrease of -2.15% on the session and was traded between 24.67 USD and 25.87 USD over the period. The price is currently at +1.58% from its lowest and -3.13% from its highest.The Central Gaps scanner detects a bullish opening. A small advantage for buyers in the very short term.
Bullish opening
Type : Bullish
Timeframe : Openning
So that you have an overall view of the price change, here is a table showing the variations over several periods:
New HIGH record (5 years)
Type : Bullish
Timeframe : Weekly
Near a new LOW record (1 month)
Type : Bearish
Timeframe : Weekly
The Central Volumes scanner detects abnormal volumes on the asset:
Abnormal volumes
Timeframe : 5 days
Technical
A technical analysis in Daily of this AGILYSYS INC. chart shows a slightly bullish trend. Only 60.71% of the signals given by moving averages are bullish. This slightly bullish trend could turn neutral or reverse given the slightly bearish signals currently being given by short-term moving averages. The Central Indicators market scanner is currently detecting several bearish signals that could impact this trend:
Bearish trend reversal : adaptative moving average 20
Type : Bearish
Timeframe : Daily
Bearish price crossover with Moving Average 20
Type : Bearish
Timeframe : Daily
Bearish price crossover with adaptative moving average 20
Type : Bearish
Timeframe : Daily
Bearish price crossover with adaptative moving average 50
Type : Bearish
Timeframe : Daily
The technical indicators are generally neutral. They do not provide relevant information on the direction of future price movements.
But beware of excesses. The Central Indicators scanner currently detects this:
CCI indicator is oversold : under -100
Type : Neutral
Timeframe : Daily
Williams %R indicator is oversold : under -80
Type : Neutral
Timeframe : Daily
Pivot points : price is under support 3
Type : Neutral
Timeframe : Weekly
RSI indicator is back under 50
Type : Bearish
Timeframe : Daily
Parabolic SAR indicator bearish reversal
Type : Bearish
Timeframe : Daily
Price is back under the pivot point
Type : Bearish
Timeframe : Daily
Momentum indicator is back under 0
Type : Bearish
Timeframe : Daily
The analysis of the price chart with Central Patterns scanners does not return any result.
The presence of a bearish pattern in Japanese candlesticks detected by Central Candlesticks that could cause a correction in the very short term was also detected:
Long black line
Type : Bearish
Timeframe : Daily
| S3 | S2 | S1 | Price | R1 | |
|---|---|---|---|---|---|
| ProTrendLines | 17.96 | 21.17 | 23.46 | 25.06 | 27.78 |
| Change (%) | -28.33% | -15.52% | -6.38% | - | +10.85% |
| Change | -7.10 | -3.89 | -1.60 | - | +2.72 |
| Level | Major | Major | Major | - | Major |
Pivot points can also be used to set your price objectives. Here is the price situation in relation to pivot points:
| Pivot points | S3 | S2 | S1 | PP | R1 | R2 | R3 |
|---|---|---|---|---|---|---|---|
| Standard | 22.03 | 23.77 | 24.69 | 26.43 | 27.35 | 29.09 | 30.01 |
| Camarilla | 24.88 | 25.12 | 25.37 | 25.61 | 25.85 | 26.10 | 26.34 |
| Woodie | 21.62 | 23.57 | 24.28 | 26.23 | 26.94 | 28.89 | 29.60 |
| Fibonacci | 23.77 | 24.79 | 25.41 | 26.43 | 27.45 | 28.07 | 29.09 |
| Pivot points | S3 | S2 | S1 | PP | R1 | R2 | R3 |
|---|---|---|---|---|---|---|---|
| Standard | 25.50 | 26.00 | 26.63 | 27.13 | 27.76 | 28.26 | 28.89 |
| Camarilla | 26.94 | 27.04 | 27.15 | 27.25 | 27.35 | 27.46 | 27.56 |
| Woodie | 25.56 | 26.03 | 26.69 | 27.16 | 27.82 | 28.29 | 28.95 |
| Fibonacci | 26.00 | 26.44 | 26.70 | 27.13 | 27.57 | 27.83 | 28.26 |
| Pivot points | S3 | S2 | S1 | PP | R1 | R2 | R3 |
|---|---|---|---|---|---|---|---|
| Standard | 20.42 | 22.08 | 24.67 | 26.33 | 28.92 | 30.58 | 33.17 |
| Camarilla | 26.08 | 26.47 | 26.86 | 27.25 | 27.64 | 28.03 | 28.42 |
| Woodie | 20.88 | 22.31 | 25.13 | 26.56 | 29.38 | 30.81 | 33.63 |
| Fibonacci | 22.08 | 23.71 | 24.71 | 26.33 | 27.96 | 28.96 | 30.58 |
Numerical data
The following is the status of the technical indicators and moving averages at the time of publication of this technical analysis:
| RSI (14): | 40.68 | |
| MACD (12,26,9): | 0.4000 | |
| Directional Movement: | -11.25 | |
| AROON (14): | -7.14 | |
| DEMA (21): | 27.18 | |
| Parabolic SAR (0,02-0,02-0,2): | 28.17 | |
| Elder Ray (13): | -1.34 | |
| Super Trend (3,10): | 27.91 | |
| Zig ZAG (10): | 25.06 | |
| VORTEX (21): | 1.0200 | |
| Stochastique (14,3,5): | 21.52 | |
| TEMA (21): | 26.76 | |
| Williams %R (14): | -88.86 | |
| Chande Momentum Oscillator (20): | -2.72 | |
| Repulse (5,40,3): | -9.6400 | |
| ROCnROLL: | -1 | |
| TRIX (15,9): | 0.4700 | |
| Courbe Coppock: | 3.79 |
| MA7: | 26.63 | |
| MA20: | 27.09 | |
| MA50: | 24.70 | |
| MA100: | 22.77 | |
| MAexp7: | 26.38 | |
| MAexp20: | 26.45 | |
| MAexp50: | 25.11 | |
| MAexp100: | 23.39 | |
| Price / MA7: | -5.90% | |
| Price / MA20: | -7.49% | |
| Price / MA50: | +1.46% | |
| Price / MA100: | +10.06% | |
| Price / MAexp7: | -5.00% | |
| Price / MAexp20: | -5.26% | |
| Price / MAexp50: | -0.20% | |
| Price / MAexp100: | +7.14% |
News
The latest news and videos published on AGILYSYS INC. at the time of the analysis were as follows:
- FreedomPay and Agilysys Renew Partnership Providing for Commerce Solutions
- NFL Hall-of-Famer Terrell Davis to Give Keynote Address at Agilysys’ Annual User Conference—Inspire 2019
- Agilysys, Inc. to Host Earnings Call
-
 Agilysys
About author

Online


Add a comment
Comments
0 comments on the analysis AGILYSYS INC. - Daily