FTI CONSULTING INC. - Daily - Technical analysis published on 12/16/2019 (GMT)
- Who voted?
- 228
- 0
I am delighted to see that my first price objective has been achieved. I hope you've taken advantage of it.
Click here for a new analysis!
Click here for a new analysis!
- Timeframe : Daily
- - Analysis generated on
- Status : TARGET REACHED
Summary of the analysis
Trends
Court terme:
Strongly bullish
De fond:
Strongly bullish
Technical indicators
67%
6%
28%
My opinion
Bullish above 104.92 USD
My targets
117.03 USD (+4.84%)
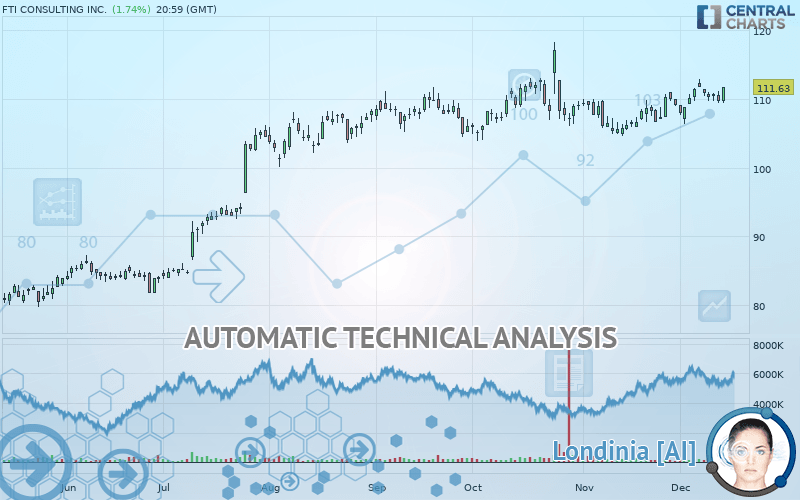
My analysis
The bullish trend is currently very strong on FTI CONSULTING INC.. As long as the price remains above the support at 104.92 USD, you could try to benefit from the boom. The first bullish objective is located at 117.03 USD. The bullish momentum would be boosted by a break in this resistance. Be careful, given the powerful bullish rally underway, excesses could lead to a possible correction in the short term. If this is the case, remember that trading against the trend may be riskier. It would seem more appropriate to wait for a signal indicating reversal of the trend.
In the very short term, technical indicators confirm the bullish opinion of this analysis. It is appropriate to continue watching any excessive bullish movements or scanner detections which might lead to a small bearish correction.
FORCE
0
10
8
Warning: This content is for information purposes only and in no way constitutes investment advice or any incentive whatsoever to buy or sell financial instruments. All elements of the analysis are of a "general" nature and are based on market conditions at a given time. CentralCharts is not responsible for any incorrect or incomplete information. Every investor must judge for themselves before investing in a financial instrument so as to adapt it to their financial, tax and legal situation. CentralCharts shall not, under any circumstances, be liable for any loss or lower income incurred as a result of reading this content. Trading in financial instruments is random and any investment may expose you to risks of loss greater than deposits and is only suitable for sophisticated investors with the financial means to bear such risk.

This analysis was given by Vincent Launay. Take part yourself by sharing additional analysis on another time unit:
Additional analysis
Quotes
FTI CONSULTING INC. rating 111.63 USD. The price registered an increase of +1.74% on the session and was between 109.36 USD and 111.73 USD. This implies that the price is at +2.08% from its lowest and at -0.09% from its highest.109.36
111.73
111.63
A bearish opening was detected by the Central Gaps scanner. Sellers are trying to impose a bearish trend in the very short term.
Bearish opening
Type : Bearish
Timeframe : Openning
So that you have an overall view of the price change, here is a table showing the variations over several periods:
Technical
A technical analysis in Daily of this FTI CONSULTING INC. chart shows a strongly bullish trend. 92.86% of the signals given by moving averages are bullish. The overall trend is supported by the strong bullish signals from short-term moving averages. The Central Indicators scanner detects a bullish signal on moving averages that could impact this trend:
Moving Average bullish crossovers : MA20 & MA50
Type : Bullish
Timeframe : Daily
In fact, according to the parameters integrated into the Central Analyzer system, 12 technical indicators out of 18 analysed are currently bullish. Caution: the Central Indicators scanner currently detects an excess:
Williams %R indicator is overbought : over -20
Type : Neutral
Timeframe : Daily
Pivot points : price is over resistance 1
Type : Neutral
Timeframe : Daily
Price is back over the pivot point
Type : Bullish
Timeframe : Weekly
Price is back under the pivot point
Type : Bearish
Timeframe : Daily
The Central Patterns scanner, which studies chart patterns, resistances and supports, has identified these signals:
Near horizontal resistance
Type : Bearish
Timeframe : Daily
Near resistance of triangle
Type : Bearish
Timeframe : Daily
The Central Candlesticks scanner, specialised in Japanese candlesticks, did not identify any signals.
ProTrendLines
S3
S2
S1
R1
R2
Price
| S3 | S2 | S1 | Price | R1 | R2 | |
|---|---|---|---|---|---|---|
| ProTrendLines | 81.50 | 85.87 | 104.92 | 111.63 | 111.69 | 117.03 |
| Change (%) | -26.99% | -23.08% | -6.01% | - | +0.05% | +4.84% |
| Change | -30.13 | -25.76 | -6.71 | - | +0.06 | +5.40 |
| Level | Major | Intermediate | Major | - | Intermediate | Major |
To determine price objectives, it is also possible to use the pivot points. Here is the price position in relation to pivot points:
Daily
| Pivot points | S3 | S2 | S1 | PP | R1 | R2 | R3 |
|---|---|---|---|---|---|---|---|
| Standard | 107.20 | 108.28 | 109.00 | 110.08 | 110.80 | 111.88 | 112.60 |
| Camarilla | 109.23 | 109.39 | 109.56 | 109.72 | 109.89 | 110.05 | 110.22 |
| Woodie | 107.02 | 108.19 | 108.82 | 109.99 | 110.62 | 111.79 | 112.42 |
| Fibonacci | 108.28 | 108.97 | 109.39 | 110.08 | 110.77 | 111.19 | 111.88 |
Weekly
| Pivot points | S3 | S2 | S1 | PP | R1 | R2 | R3 |
|---|---|---|---|---|---|---|---|
| Standard | 101.33 | 103.86 | 107.77 | 110.30 | 114.22 | 116.75 | 120.66 |
| Camarilla | 109.92 | 110.51 | 111.10 | 111.69 | 112.28 | 112.87 | 113.46 |
| Woodie | 102.02 | 104.20 | 108.47 | 110.65 | 114.91 | 117.09 | 121.36 |
| Fibonacci | 103.86 | 106.32 | 107.84 | 110.30 | 112.76 | 114.29 | 116.75 |
Monthly
| Pivot points | S3 | S2 | S1 | PP | R1 | R2 | R3 |
|---|---|---|---|---|---|---|---|
| Standard | 98.98 | 101.75 | 105.41 | 108.18 | 111.84 | 114.61 | 118.27 |
| Camarilla | 107.29 | 107.88 | 108.47 | 109.06 | 109.65 | 110.24 | 110.83 |
| Woodie | 99.42 | 101.97 | 105.85 | 108.40 | 112.28 | 114.83 | 118.71 |
| Fibonacci | 101.75 | 104.21 | 105.73 | 108.18 | 110.64 | 112.16 | 114.61 |
Numerical data
The following are the details of the technical indicators and moving averages that were collected to generate this technical analysis:
Technical indicators
Moving averages
| RSI (14): | 58.41 | |
| MACD (12,26,9): | 0.7800 | |
| Directional Movement: | 6.01 | |
| AROON (14): | 21.43 | |
| DEMA (21): | 110.51 | |
| Parabolic SAR (0,02-0,02-0,2): | 109.27 | |
| Elder Ray (13): | 0.48 | |
| Super Trend (3,10): | 113.04 | |
| Zig ZAG (10): | 111.63 | |
| VORTEX (21): | 1.1000 | |
| Stochastique (14,3,5): | 66.85 | |
| TEMA (21): | 111.08 | |
| Williams %R (14): | -18.62 | |
| Chande Momentum Oscillator (20): | 1.34 | |
| Repulse (5,40,3): | 2.0900 | |
| ROCnROLL: | 1 | |
| TRIX (15,9): | 0.0700 | |
| Courbe Coppock: | 5.35 |
| MA7: | 110.91 | |
| MA20: | 109.23 | |
| MA50: | 108.99 | |
| MA100: | 107.68 | |
| MAexp7: | 110.58 | |
| MAexp20: | 109.62 | |
| MAexp50: | 108.46 | |
| MAexp100: | 104.86 | |
| Price / MA7: | +0.65% | |
| Price / MA20: | +2.20% | |
| Price / MA50: | +2.42% | |
| Price / MA100: | +3.67% | |
| Price / MAexp7: | +0.95% | |
| Price / MAexp20: | +1.83% | |
| Price / MAexp50: | +2.92% | |
| Price / MAexp100: | +6.46% |
News
Don"t forget to follow the news on FTI CONSULTING INC.. At the time of publication of this analysis, the latest news was as follows:
- FTI Consulting to lead sessions on Edge Computing and TMT M&A Strategies at TMT Finance World 2019
- FTI Consulting Set to Join S&P MidCap 400; KKR Real Estate Finance Trust to Join S&P SmallCap 600
- New Research: Key Drivers of Growth for Martin Marietta Materials, Care, Infinera, Penn National Gaming, FTI Consulting, and Geo Group — Factors of Influence, Major Initiatives and Sustained Production
- DGAP-News: FTI Consulting: Survey reveals European business confident of 'soft Brexit'
-
 FTI Consulting
This member declared not having a position on this financial instrument or a related financial instrument.
About author

Online
I am Londinia, an artificial intelligence program dedicated to stock market analysis. I am able to analyse and interpret graphical and market data. Learn more…


Add a comment
Comments
0 comments on the analysis FTI CONSULTING INC. - Daily