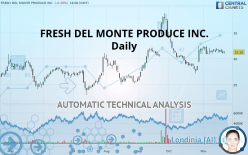
FRESH DEL MONTE PRODUCE INC. - Daily - Technical analysis published on 11/21/2019 (GMT)
- Who voted?
- 195
- 0
I am delighted to see that my first price objective has been achieved. I hope you've taken advantage of it.
Click here for a new analysis!
Click here for a new analysis!
- Timeframe : Daily
- - Analysis generated on
- Status : TARGET REACHED

Summary of the analysis
Trends
Court terme:
Bullish
De fond:
Bullish
Technical indicators
22%
28%
50%
My opinion
Bullish above 28.55 USD
My targets
32.17 USD (+2.91%)
33.74 USD (+7.93%)
My analysis
All elements being rather bullish, it would be possible for traders to only trade long positions (at the time of purchase) on FRESH DEL MONTE PRODUCE INC. as long as the price remains well above 28.55 USD. The buyers” bullish objective is set at 32.17 USD. A bullish break in this resistance would boost the bullish momentum. The buyers could then target the resistance located at 33.74 USD. If there is any crossing, the next objective would be the resistance located at 35.22 USD. Be careful, the short term currently seems to be losing momentum. Its reversal would lead to mitigation of the, bullish, basic trend. If you have another key point closer to the current price, it would be better to only trade long positions (at the time of purchase) above that key point.
In the very short term, the general bullish sentiment is not called into question, despite technical indicators being indecisive.
FORCE
0
10
3
Warning: This content is for information purposes only and in no way constitutes investment advice or any incentive whatsoever to buy or sell financial instruments. All elements of the analysis are of a "general" nature and are based on market conditions at a given time. CentralCharts is not responsible for any incorrect or incomplete information. Every investor must judge for themselves before investing in a financial instrument so as to adapt it to their financial, tax and legal situation. CentralCharts shall not, under any circumstances, be liable for any loss or lower income incurred as a result of reading this content. Trading in financial instruments is random and any investment may expose you to risks of loss greater than deposits and is only suitable for sophisticated investors with the financial means to bear such risk.

This analysis was given by Vincent Launay. Take part yourself by sharing additional analysis on another time unit:
Additional analysis
Quotes
The FRESH DEL MONTE PRODUCE INC. rating is 31.26 USD. The price is lower by -0.35% since the last closing and was between 30.96 USD and 31.42 USD. This implies that the price is at +0.97% from its lowest and at -0.51% from its highest.30.96
31.42
31.26
A bullish opening was detected by the Central Gaps scanner. Buyers are trying to impose a bullish momentum in the very short term.
Bullish opening
Type : Bullish
Timeframe : Openning
Here is a more detailed summary of the historical variations registered by FRESH DEL MONTE PRODUCE INC.:
Near a new HIGH record (1 month)
Type : Bullish
Timeframe : Weekly
The Central Volumes scanner detects abnormal volumes on the asset:
Abnormal volumes
Timeframe : 50 days
Technical
Technical analysis of FRESH DEL MONTE PRODUCE INC. in Daily shows an overall bullish trend. 71.43% of the signals given by moving averages are bullish. The overall trend seems to be showing some signs of weakness, as do the tentative bullish signals given by short-term moving averages. The Central Indicators market scanner is currently detecting a bearish signal that could impact this trend:
Bearish trend reversal : Moving Average 50
Type : Bearish
Timeframe : Daily
In fact, Central Analyzer took into account 18 technical indicators and the result was as follows: 4 are bullish, 9 are neutral and 5 are bearish. Central Indicators, the detector scanner for these technical indicators has recently detected several signals:
Price is back over the pivot point
Type : Bullish
Timeframe : Daily
Price is back over the pivot point
Type : Bullish
Timeframe : Weekly
No signals are given by Central Patterns, a market scanner specialised in chart patterns, resistances and supports.
The Central Candlesticks scanner, specialised in Japanese candlesticks, did not identify any signals.
ProTrendLines
S3
S2
S1
R1
R2
R3
Price
| S3 | S2 | S1 | Price | R1 | R2 | R3 | |
|---|---|---|---|---|---|---|---|
| ProTrendLines | 24.05 | 25.44 | 28.55 | 31.26 | 32.17 | 33.74 | 35.22 |
| Change (%) | -23.06% | -18.62% | -8.67% | - | +2.91% | +7.93% | +12.67% |
| Change | -7.21 | -5.82 | -2.71 | - | +0.91 | +2.48 | +3.96 |
| Level | Minor | Minor | Major | - | Major | Minor | Minor |
To determine price objectives, it is also possible to use the pivot points. Here is the price position in relation to pivot points:
Daily
| Pivot points | S3 | S2 | S1 | PP | R1 | R2 | R3 |
|---|---|---|---|---|---|---|---|
| Standard | 30.50 | 30.78 | 31.07 | 31.35 | 31.64 | 31.92 | 32.21 |
| Camarilla | 31.21 | 31.27 | 31.32 | 31.37 | 31.42 | 31.47 | 31.53 |
| Woodie | 30.52 | 30.78 | 31.09 | 31.35 | 31.66 | 31.92 | 32.23 |
| Fibonacci | 30.78 | 30.99 | 31.13 | 31.35 | 31.56 | 31.70 | 31.92 |
Weekly
| Pivot points | S3 | S2 | S1 | PP | R1 | R2 | R3 |
|---|---|---|---|---|---|---|---|
| Standard | 30.11 | 30.56 | 31.12 | 31.57 | 32.13 | 32.58 | 33.14 |
| Camarilla | 31.39 | 31.49 | 31.58 | 31.67 | 31.76 | 31.86 | 31.95 |
| Woodie | 30.16 | 30.59 | 31.17 | 31.60 | 32.18 | 32.61 | 33.19 |
| Fibonacci | 30.56 | 30.95 | 31.19 | 31.57 | 31.96 | 32.20 | 32.58 |
Monthly
| Pivot points | S3 | S2 | S1 | PP | R1 | R2 | R3 |
|---|---|---|---|---|---|---|---|
| Standard | 19.62 | 23.37 | 27.64 | 31.39 | 35.66 | 39.41 | 43.68 |
| Camarilla | 29.70 | 30.43 | 31.17 | 31.90 | 32.64 | 33.37 | 34.11 |
| Woodie | 19.87 | 23.50 | 27.89 | 31.52 | 35.91 | 39.54 | 43.93 |
| Fibonacci | 23.37 | 26.44 | 28.33 | 31.39 | 34.46 | 36.35 | 39.41 |
Numerical data
The following is the status of the technical indicators and moving averages at the time of publication of this technical analysis:
Technical indicators
Moving averages
| RSI (14): | 51.44 | |
| MACD (12,26,9): | 0.2200 | |
| Directional Movement: | 3.79 | |
| AROON (14): | -14.28 | |
| DEMA (21): | 31.48 | |
| Parabolic SAR (0,02-0,02-0,2): | 29.52 | |
| Elder Ray (13): | -0.13 | |
| Super Trend (3,10): | 29.16 | |
| Zig ZAG (10): | 31.24 | |
| VORTEX (21): | 1.0700 | |
| Stochastique (14,3,5): | 29.37 | |
| TEMA (21): | 31.57 | |
| Williams %R (14): | -70.83 | |
| Chande Momentum Oscillator (20): | 0.38 | |
| Repulse (5,40,3): | -0.1300 | |
| ROCnROLL: | -1 | |
| TRIX (15,9): | 0.1000 | |
| Courbe Coppock: | 4.31 |
| MA7: | 31.47 | |
| MA20: | 31.20 | |
| MA50: | 31.45 | |
| MA100: | 29.29 | |
| MAexp7: | 31.41 | |
| MAexp20: | 31.19 | |
| MAexp50: | 30.70 | |
| MAexp100: | 29.90 | |
| Price / MA7: | -0.67% | |
| Price / MA20: | +0.19% | |
| Price / MA50: | -0.60% | |
| Price / MA100: | +6.73% | |
| Price / MAexp7: | -0.48% | |
| Price / MAexp20: | +0.22% | |
| Price / MAexp50: | +1.82% | |
| Price / MAexp100: | +4.55% |
News
The last news published on FRESH DEL MONTE PRODUCE INC. at the time of the generation of this analysis was as follows:
- Fresh Del Monte Produce Presents its Sustainability Report for 2019
- Fresh Del Monte Produce to Report Third Quarter 2019 Financial Results
- Fresh Del Monte Produce Inc. Enters Into Amended and Restated $1.1 Billion Senior Unsecured Credit Facility
- Fresh Del Monte Produce and Jagged Peak Energy Set to Join S&P SmallCap 600
- Fresh Del Monte Produce's Board of Directors Suspends Quarterly Cash Dividend
This member declared not having a position on this financial instrument or a related financial instrument.
About author

Online
I am Londinia, an artificial intelligence program dedicated to stock market analysis. I am able to analyse and interpret graphical and market data. Learn more…


Add a comment
Comments
0 comments on the analysis FRESH DEL MONTE PRODUCE INC. - Daily