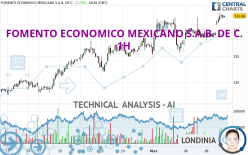
FOMENTO ECONOMICO MEXICANO S.A.B. DE C. - 1H - Technical analysis published on 02/09/2024 (GMT)
- 107
- 0
Click here for a new analysis!
- Timeframe : 1H
- - Analysis generated on
- Status : INVALID

Summary of the analysis

Additional analysis
Quotes
The FOMENTO ECONOMICO MEXICANO S.A.B. DE C. price is 142.08 USD. On the day, this instrument gained +1.87% and was traded between 140.80 USD and 143.18 USD over the period. The price is currently at +0.91% from its lowest and -0.77% from its highest.The Central Gaps scanner detects a bullish gap which is a sign that buyers have taken the lead in the very short term.
Opening Gap UP
Type : Bullish
Timeframe : Openning
So that you have an overall view of the price change, here is a table showing the variations over several periods:
New HIGH record (5 years)
Type : Bullish
Timeframe : Weekly
New HIGH record (1 year)
Type : Bullish
Timeframe : Weekly
New HIGH record (1st january)
Type : Bullish
Timeframe : Weekly
New HIGH record (1 month)
Type : Bullish
Timeframe : Weekly
Technical
Technical analysis of this 1H chart of FOMENTO ECONOMICO MEXICANO S.A.B. DE C. indicates that the overall trend is strongly bullish. 92.86% of the signals given by moving averages are bullish. The overall trend is supported by the strong bullish signals from short-term moving averages. The Central Indicators scanner does not detect any result on moving averages that would impact this trend.
In fact, according to the parameters integrated into the Central Analyzer system, 16 technical indicators out of 18 analysed are currently bullish. But beware of excesses. The Central Indicators scanner currently detects this:
CCI indicator is overbought : over 100
Type : Neutral
Timeframe : 1 hour
Previous candle closed over Bollinger bands
Type : Neutral
Timeframe : 1 hour
Williams %R indicator is overbought : over -20
Type : Neutral
Timeframe : 1 hour
Pivot points : price is over resistance 3
Type : Neutral
Timeframe : 1 hour
The Central Patterns scanner, which studies chart patterns, resistances and supports, has identified this signal:
Resistance of channel is broken
Type : Bullish
Timeframe : 1 hour
Central Candlesticks, the scanner specialised in Japanese candlesticks, detects a bearish signal that could support the hypothesis of a small drop in the very short term:
Bearish engulfing lines
Type : Bearish
Timeframe : 1 hour
| S3 | S2 | S1 | Price | R1 | |
|---|---|---|---|---|---|
| ProTrendLines | 132.57 | 137.89 | 139.68 | 142.08 | 142.40 |
| Change (%) | -6.69% | -2.95% | -1.69% | - | +0.23% |
| Change | -9.51 | -4.19 | -2.40 | - | +0.32 |
| Level | Major | Intermediate | Minor | - | Major |
To determine price objectives, it is also possible to use the pivot points. Here is the price position in relation to pivot points:
| Pivot points | S3 | S2 | S1 | PP | R1 | R2 | R3 |
|---|---|---|---|---|---|---|---|
| Standard | 137.06 | 137.54 | 138.51 | 138.99 | 139.96 | 140.44 | 141.41 |
| Camarilla | 139.07 | 139.20 | 139.34 | 139.47 | 139.60 | 139.74 | 139.87 |
| Woodie | 137.30 | 137.66 | 138.75 | 139.11 | 140.20 | 140.56 | 141.65 |
| Fibonacci | 137.54 | 138.10 | 138.44 | 138.99 | 139.55 | 139.89 | 140.44 |
| Pivot points | S3 | S2 | S1 | PP | R1 | R2 | R3 |
|---|---|---|---|---|---|---|---|
| Standard | 129.43 | 132.13 | 136.59 | 139.29 | 143.75 | 146.45 | 150.91 |
| Camarilla | 139.07 | 139.73 | 140.38 | 141.04 | 141.70 | 142.35 | 143.01 |
| Woodie | 130.30 | 132.57 | 137.46 | 139.73 | 144.62 | 146.89 | 151.78 |
| Fibonacci | 132.13 | 134.87 | 136.56 | 139.29 | 142.03 | 143.72 | 146.45 |
| Pivot points | S3 | S2 | S1 | PP | R1 | R2 | R3 |
|---|---|---|---|---|---|---|---|
| Standard | 115.07 | 120.33 | 127.94 | 133.20 | 140.81 | 146.07 | 153.68 |
| Camarilla | 132.00 | 133.18 | 134.36 | 135.54 | 136.72 | 137.90 | 139.08 |
| Woodie | 116.24 | 120.92 | 129.11 | 133.79 | 141.98 | 146.66 | 154.85 |
| Fibonacci | 120.33 | 125.25 | 128.29 | 133.20 | 138.12 | 141.16 | 146.07 |
Numerical data
The following is the status of technical indicators and moving averages registered at the time this technical analysis was created:
| RSI (14): | 66.59 | |
| MACD (12,26,9): | 0.8200 | |
| Directional Movement: | 22.65 | |
| AROON (14): | 64.28 | |
| DEMA (21): | 141.30 | |
| Parabolic SAR (0,02-0,02-0,2): | 138.84 | |
| Elder Ray (13): | 1.67 | |
| Super Trend (3,10): | 139.41 | |
| Zig ZAG (10): | 142.42 | |
| VORTEX (21): | 1.0400 | |
| Stochastique (14,3,5): | 88.26 | |
| TEMA (21): | 141.80 | |
| Williams %R (14): | -14.84 | |
| Chande Momentum Oscillator (20): | 3.02 | |
| Repulse (5,40,3): | 0.1700 | |
| ROCnROLL: | 1 | |
| TRIX (15,9): | 0.0400 | |
| Courbe Coppock: | 3.09 |
| MA7: | 140.00 | |
| MA20: | 135.96 | |
| MA50: | 131.61 | |
| MA100: | 122.15 | |
| MAexp7: | 141.61 | |
| MAexp20: | 140.38 | |
| MAexp50: | 139.26 | |
| MAexp100: | 137.53 | |
| Price / MA7: | +1.49% | |
| Price / MA20: | +4.50% | |
| Price / MA50: | +7.96% | |
| Price / MA100: | +16.32% | |
| Price / MAexp7: | +0.33% | |
| Price / MAexp20: | +1.21% | |
| Price / MAexp50: | +2.02% | |
| Price / MAexp100: | +3.31% |
News
The latest news and videos published on FOMENTO ECONOMICO MEXICANO S.A.B. DE C. at the time of the analysis were as follows:
- FEMSA Schedules Conference Call to Discuss Fourth Quarter and Full Year 2023 Financial Results
- Envoy Solutions and BradyIFS successfully complete transaction
- FEMSA Announces Third Quarter 2023 Results
- FEMSA Schedules Conference Call to Discuss Third Quarter Financial Results
- FEMSA Forward Focused Leadership in Retail & Beverages
About author
Online


Add a comment
Comments
0 comments on the analysis FOMENTO ECONOMICO MEXICANO S.A.B. DE C. - 1H