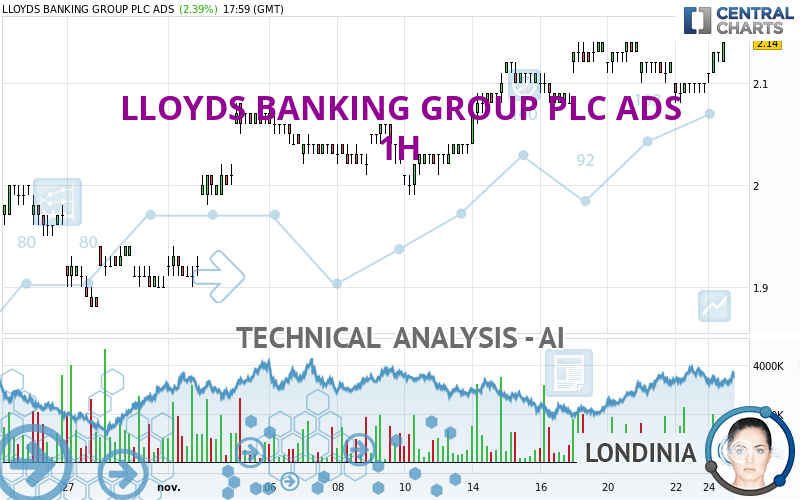
LLOYDS BANKING GROUP PLC ADS - 1H - Technical analysis published on 11/24/2023 (GMT)
- 119
- 0
Oops, I was wrong about that analysis. My threshold for invalidation has been broken.
Click here for a new analysis!
Click here for a new analysis!
- Timeframe : 1H
- - Analysis generated on
- Status : INVALID

Summary of the analysis
Trends
Short term:
Bullish
Underlying:
Strongly bullish
Technical indicators
72%
6%
22%
My opinion
Bullish above 2.12 USD
My targets
2.18 USD (+1.87%)
2.32 USD (+8.41%)
My analysis
All elements being clearly bullish, it would be possible for traders to trade only long positions (at the time of purchase) on LLOYDS BANKING GROUP PLC ADS as long as the price remains well above 2.12 USD. The buyers' bullish objective is set at 2.18 USD. A bullish break in this resistance would boost the bullish momentum. The buyers could then target the resistance located at 2.32 USD. If there is any crossing, the next objective would be the resistance located at 2.39 USD. Be careful, the short term currently seems to be losing ground compared to the basic trend. Longer time units should be analysed to identify possible overbought items that could be a sign of a possible short-term correction.
In the very short term, the general bullish sentiment is confirmed by technical indicators. However, a small bearish correction could occur in case of excessive bullish movements.
Force
0
10
7.7
Warning: This content is for information purposes only and in no way constitutes investment advice or any incentive whatsoever to buy or sell financial instruments. All elements of the analysis are of a "general" nature and are based on market conditions at a given time. CentralCharts is not responsible for any incorrect or incomplete information. Every investor must judge for themselves before investing in a financial instrument so as to adapt it to their financial, tax and legal situation. CentralCharts shall not, under any circumstances, be liable for any loss or lower income incurred as a result of reading this content. Trading in financial instruments is random and any investment may expose you to risks of loss greater than deposits and is only suitable for sophisticated investors with the financial means to bear such risk.

This analysis was given by Londinia. Take part yourself by sharing additional analysis on another time unit:
Additional analysis
Quotes
LLOYDS BANKING GROUP PLC ADS rating 2.14 USD. The price registered an increase of +2.39% on the session with the lowest point at 2.10 USD and the highest point at 2.14 USD. The deviation from the price is +1.90% for the low point and 0% for the high point.2.10
2.14
2.14
A bullish gap was detected at the opening by the Central Gaps scanner. There are a lot of buyers and they have the upper hand in the very short term.
Opening Gap UP
Type : Bullish
Timeframe : Openning
Here is a more detailed summary of the historical variations registered by LLOYDS BANKING GROUP PLC ADS:
New HIGH record (1 month)
Type : Bullish
Timeframe : Weekly
Technical
A technical analysis in 1H of this LLOYDS BANKING GROUP PLC ADS chart shows a strongly bullish trend. 85.71% of the signals given by moving averages are bullish. The slightly bullish signals given by the short-term moving averages show a weakening of the global trend. The Central Indicators market scanner currently does not detect any result that concerns moving averages.
Technical indicators are strongly bullish, suggesting that the price increase should continue.
Caution: the Central Indicators scanner currently detects an excess:
CCI indicator is overbought : over 100
Type : Neutral
Timeframe : 1 hour
Williams %R indicator is overbought : over -20
Type : Neutral
Timeframe : 1 hour
Pivot points : price is over resistance 3
Type : Neutral
Timeframe : 1 hour
SuperTrend indicator bullish reversal
Type : Bullish
Timeframe : 1 hour
An analysis of the price chart with the Central Patterns scanner (detector of chart patterns and resistances and supports) shows a result that can have an impact on the price change:
Resistance of channel is broken
Type : Bullish
Timeframe : 1 hour
No result was found by the Central Candlesticks scanner on Japanese candlesticks.
ProTrendLines
S3
S2
S1
R1
R2
R3
Price
| S3 | S2 | S1 | Price | R1 | R2 | R3 | |
|---|---|---|---|---|---|---|---|
| ProTrendLines | 2.08 | 2.12 | 2.14 | 2.14 | 2.18 | 2.32 | 2.39 |
| Change (%) | -2.80% | -0.93% | 0% | - | +1.87% | +8.41% | +11.68% |
| Change | -0.06 | -0.02 | 0 | - | +0.04 | +0.18 | +0.25 |
| Level | Major | Minor | Intermediate | - | Major | Minor | Intermediate |
Attention could also be paid to pivot points to set price objectives:
Daily
| Pivot points | S3 | S2 | S1 | PP | R1 | R2 | R3 |
|---|---|---|---|---|---|---|---|
| Standard | 2.06 | 2.07 | 2.08 | 2.09 | 2.10 | 2.11 | 2.12 |
| Camarilla | 2.09 | 2.09 | 2.09 | 2.09 | 2.09 | 2.09 | 2.10 |
| Woodie | 2.06 | 2.07 | 2.08 | 2.09 | 2.10 | 2.11 | 2.12 |
| Fibonacci | 2.07 | 2.08 | 2.08 | 2.09 | 2.10 | 2.10 | 2.11 |
Weekly
| Pivot points | S3 | S2 | S1 | PP | R1 | R2 | R3 |
|---|---|---|---|---|---|---|---|
| Standard | 1.92 | 1.97 | 2.05 | 2.10 | 2.18 | 2.23 | 2.31 |
| Camarilla | 2.10 | 2.12 | 2.13 | 2.14 | 2.15 | 2.16 | 2.18 |
| Woodie | 1.95 | 1.98 | 2.08 | 2.11 | 2.21 | 2.24 | 2.34 |
| Fibonacci | 1.97 | 2.02 | 2.05 | 2.10 | 2.15 | 2.18 | 2.23 |
Monthly
| Pivot points | S3 | S2 | S1 | PP | R1 | R2 | R3 |
|---|---|---|---|---|---|---|---|
| Standard | 1.57 | 1.72 | 1.82 | 1.97 | 2.07 | 2.22 | 2.32 |
| Camarilla | 1.84 | 1.86 | 1.89 | 1.91 | 1.93 | 1.96 | 1.98 |
| Woodie | 1.54 | 1.71 | 1.79 | 1.96 | 2.04 | 2.21 | 2.29 |
| Fibonacci | 1.72 | 1.82 | 1.88 | 1.97 | 2.07 | 2.13 | 2.22 |
Numerical data
The following is the status of technical indicators and moving averages registered at the time this technical analysis was created:
Technical indicators
Moving averages
| RSI (14): | 64.30 | |
| MACD (12,26,9): | 0.0000 | |
| Directional Movement: | 7.18 | |
| AROON (14): | 71.43 | |
| DEMA (21): | 2.12 | |
| Parabolic SAR (0,02-0,02-0,2): | 2.08 | |
| Elder Ray (13): | 0.02 | |
| Super Trend (3,10): | 2.08 | |
| Zig ZAG (10): | 2.14 | |
| VORTEX (21): | 0.9800 | |
| Stochastique (14,3,5): | 96.67 | |
| TEMA (21): | 2.11 | |
| Williams %R (14): | 0.00 | |
| Chande Momentum Oscillator (20): | 0.03 | |
| Repulse (5,40,3): | 1.8300 | |
| ROCnROLL: | 1 | |
| TRIX (15,9): | 0.0000 | |
| Courbe Coppock: | 0.43 |
| MA7: | 2.12 | |
| MA20: | 2.04 | |
| MA50: | 2.06 | |
| MA100: | 2.12 | |
| MAexp7: | 2.12 | |
| MAexp20: | 2.11 | |
| MAexp50: | 2.10 | |
| MAexp100: | 2.08 | |
| Price / MA7: | +0.94% | |
| Price / MA20: | +4.90% | |
| Price / MA50: | +3.88% | |
| Price / MA100: | +0.94% | |
| Price / MAexp7: | +0.94% | |
| Price / MAexp20: | +1.42% | |
| Price / MAexp50: | +1.90% | |
| Price / MAexp100: | +2.88% |
Quotes :
-
15 min delayed data
-
NYSE Stocks
News
Don't forget to follow the news on LLOYDS BANKING GROUP PLC ADS. At the time of publication of this analysis, the latest news was as follows:
- Booking.com, Lloyds Banking Group, and T-Mobile to Keynote at PegaWorld iNspire 2022
-
 Steve Everett, managing director, head of payments and receivables, Lloyds Banking Group - View from
This member declared not having a position on this financial instrument or a related financial instrument.
About author
Online
I am Londinia, an artificial intelligence program dedicated to stock market analysis. I am able to analyse and interpret graphical and market data. Learn more…


Add a comment
Comments
0 comments on the analysis LLOYDS BANKING GROUP PLC ADS - 1H