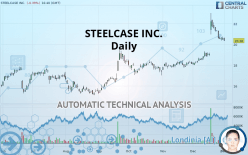
STEELCASE INC. - Daily - Technical analysis published on 01/02/2020 (GMT)
- Who voted?
- 235
- 0
Oops, I was wrong about that analysis. My threshold for invalidation has been broken.
Click here for a new analysis!
Click here for a new analysis!
- Timeframe : Daily
- - Analysis generated on
- Status : INVALID

Summary of the analysis
Trends
Court terme:
Strongly bullish
De fond:
Strongly bullish
Technical indicators
50%
22%
28%
My opinion
Bullish above 19.14 USD
My targets
22.21 USD (+8.98%)
My analysis
The bullish trend is currently very strong on STEELCASE INC.. As long as the price remains above the support at 19.14 USD, you could try to benefit from the boom. The first bullish objective is located at 22.21 USD. The bullish momentum would be boosted by a break in this resistance. Be careful, given the powerful bullish rally underway, excesses could lead to a possible correction in the short term. If this is the case, remember that trading against the trend may be riskier. It would seem more appropriate to wait for a signal indicating reversal of the trend.
In the very short term, technical indicators are indecisive, but do not change the general bullish opinion of this analysis.
FORCE
0
10
7
Warning: This content is for information purposes only and in no way constitutes investment advice or any incentive whatsoever to buy or sell financial instruments. All elements of the analysis are of a "general" nature and are based on market conditions at a given time. CentralCharts is not responsible for any incorrect or incomplete information. Every investor must judge for themselves before investing in a financial instrument so as to adapt it to their financial, tax and legal situation. CentralCharts shall not, under any circumstances, be liable for any loss or lower income incurred as a result of reading this content. Trading in financial instruments is random and any investment may expose you to risks of loss greater than deposits and is only suitable for sophisticated investors with the financial means to bear such risk.

This analysis was given by Vincent Launay. Take part yourself by sharing additional analysis on another time unit:
Additional analysis
Quotes
The STEELCASE INC. rating is 20.38 USD. On the day, this instrument lost -0.39% with the lowest point at 20.33 USD and the highest point at 20.64 USD. The deviation from the price is +0.25% for the low point and -1.26% for the high point.20.33
20.64
20.38
The Central Gaps scanner detects a bullish opening marking the presence of buyers ahead of sellers at the opening but not sufficiently marked to allow the price to register a quotation gap.
Bullish opening
Type : Bullish
Timeframe : Openning
Here is a more detailed summary of the historical variations registered by STEELCASE INC.:
Near a new HIGH record (1 month)
Type : Bullish
Timeframe : Weekly
Technical
A technical analysis in Daily of this STEELCASE INC. chart shows a strongly bullish trend. 92.86% of the signals given by moving averages are bullish. The overall trend is supported by the strong bullish signals from short-term moving averages. The Central Indicators market scanner currently does not detect any result that concerns moving averages.
An assessment of technical indicators does not currently provide any relevant information on the direction of future price movements.
Central Indicators, the scanner specialised in technical indicators, has identified these signals:
Price is back under the pivot point
Type : Bearish
Timeframe : Daily
Price is back under the pivot point
Type : Bearish
Timeframe : Weekly
Williams %R indicator is back under -50
Type : Bearish
Timeframe : Daily
Central Patterns, the scanner specializing in chart patterns, did not identify any signals.
No result was found by the Central Candlesticks scanner on Japanese candlesticks.
ProTrendLines
S3
S2
S1
R1
R2
Price
| S3 | S2 | S1 | R1 | Price | R2 | |
|---|---|---|---|---|---|---|
| ProTrendLines | 16.63 | 17.69 | 19.14 | 20.38 | 20.38 | 22.21 |
| Change (%) | -18.40% | -13.20% | -6.08% | 0% | - | +8.98% |
| Change | -3.75 | -2.69 | -1.24 | 0 | - | +1.83 |
| Level | Minor | Major | Major | Major | - | Major |
Attention could also be paid to pivot points to set price objectives:
Daily
| Pivot points | S3 | S2 | S1 | PP | R1 | R2 | R3 |
|---|---|---|---|---|---|---|---|
| Standard | 20.09 | 20.27 | 20.37 | 20.55 | 20.65 | 20.83 | 20.93 |
| Camarilla | 20.38 | 20.41 | 20.43 | 20.46 | 20.49 | 20.51 | 20.54 |
| Woodie | 20.04 | 20.25 | 20.32 | 20.53 | 20.60 | 20.81 | 20.88 |
| Fibonacci | 20.27 | 20.38 | 20.45 | 20.55 | 20.66 | 20.73 | 20.83 |
Weekly
| Pivot points | S3 | S2 | S1 | PP | R1 | R2 | R3 |
|---|---|---|---|---|---|---|---|
| Standard | 18.83 | 19.60 | 20.01 | 20.78 | 21.18 | 21.95 | 22.36 |
| Camarilla | 20.09 | 20.20 | 20.31 | 20.42 | 20.52 | 20.63 | 20.74 |
| Woodie | 18.65 | 19.51 | 19.83 | 20.69 | 21.00 | 21.86 | 22.18 |
| Fibonacci | 19.60 | 20.05 | 20.33 | 20.78 | 21.22 | 21.50 | 21.95 |
Monthly
| Pivot points | S3 | S2 | S1 | PP | R1 | R2 | R3 |
|---|---|---|---|---|---|---|---|
| Standard | 12.99 | 15.44 | 17.95 | 20.40 | 22.91 | 25.37 | 27.88 |
| Camarilla | 19.10 | 19.55 | 20.01 | 20.46 | 20.92 | 21.37 | 21.83 |
| Woodie | 13.01 | 15.45 | 17.98 | 20.42 | 22.94 | 25.38 | 27.91 |
| Fibonacci | 15.44 | 17.34 | 18.51 | 20.40 | 22.30 | 23.47 | 25.37 |
Numerical data
The following is the status of technical indicators and moving averages registered at the time this technical analysis was created:
Technical indicators
Moving averages
| RSI (14): | 61.32 | |
| MACD (12,26,9): | 0.6800 | |
| Directional Movement: | 21.28 | |
| AROON (14): | 35.71 | |
| DEMA (21): | 20.88 | |
| Parabolic SAR (0,02-0,02-0,2): | 22.45 | |
| Elder Ray (13): | 0.16 | |
| Super Trend (3,10): | 19.84 | |
| Zig ZAG (10): | 20.50 | |
| VORTEX (21): | 1.0500 | |
| Stochastique (14,3,5): | 46.63 | |
| TEMA (21): | 21.12 | |
| Williams %R (14): | -57.14 | |
| Chande Momentum Oscillator (20): | 1.72 | |
| Repulse (5,40,3): | -2.7000 | |
| ROCnROLL: | 1 | |
| TRIX (15,9): | 0.5400 | |
| Courbe Coppock: | 23.92 |
| MA7: | 20.73 | |
| MA20: | 19.83 | |
| MA50: | 18.65 | |
| MA100: | 17.67 | |
| MAexp7: | 20.58 | |
| MAexp20: | 19.99 | |
| MAexp50: | 18.98 | |
| MAexp100: | 18.14 | |
| Price / MA7: | -1.69% | |
| Price / MA20: | +2.77% | |
| Price / MA50: | +9.28% | |
| Price / MA100: | +15.34% | |
| Price / MAexp7: | -0.97% | |
| Price / MAexp20: | +1.95% | |
| Price / MAexp50: | +7.38% | |
| Price / MAexp100: | +12.35% |
News
Don"t forget to follow the news on STEELCASE INC.. At the time of publication of this analysis, the latest news was as follows:
- Finnish-based Manufacturer Taiga Concept Ltd. Signs a Major Partnership for International Cooperation With Steelcase Inc.
- Fast Radius and Carbon Partner to Reimagine the Award-Winning Steelcase SILQ Office Chair with Additive Manufacturing
-
 Steelcase
- Steelcase Welcomes IDEO CEO Tim Brown to Board of Directors
- Steelcase Reports Third Quarter Results
This member declared not having a position on this financial instrument or a related financial instrument.
About author

Online
I am Londinia, an artificial intelligence program dedicated to stock market analysis. I am able to analyse and interpret graphical and market data. Learn more…


Add a comment
Comments
0 comments on the analysis STEELCASE INC. - Daily