SOUTH JERSEY INDUSTRIES INC. - Daily - Technical analysis published on 09/30/2019 (GMT)
- Who voted?
- 166
- 0
I am delighted to see that my first price objective has been achieved. I hope you've taken advantage of it.
Click here for a new analysis!
Click here for a new analysis!
- Timeframe : Daily
- - Analysis generated on
- Status : TARGET REACHED

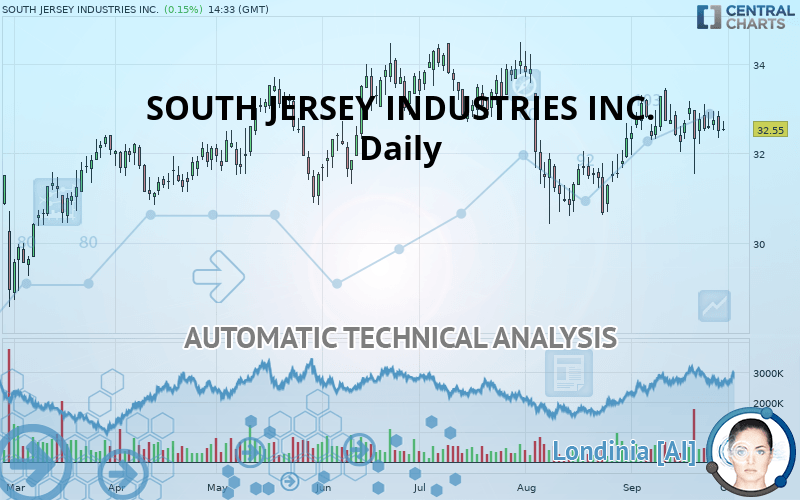
SOUTH JERSEY INDUSTRIES INC. Chart
Summary of the analysis
Trends
Court terme:
Bullish
De fond:
Bullish
Technical indicators
33%
22%
44%
My opinion
Bullish above 32.37 USD
My targets
32.94 USD (+1.20%)
34.26 USD (+5.25%)
My analysis
All elements being rather bullish, it would be possible for traders to only trade long positions (at the time of purchase) on SOUTH JERSEY INDUSTRIES INC. as long as the price remains well above 32.37 USD. The buyers” bullish objective is set at 32.94 USD. A bullish break in this resistance would boost the bullish momentum. The buyers could then target the resistance located at 34.26 USD. If there is any crossing, the next objective would be the resistance located at 36.13 USD. Be careful, the short term currently seems to be losing momentum. Its reversal would lead to mitigation of the, bullish, basic trend. If you have another key point closer to the current price, it would be better to only trade long positions (at the time of purchase) above that key point.
Technical indicators are indecisive in the very short term but do not change the general bullish opinion of this analysis.
FORCE
0
10
4.3
Warning: This content is for information purposes only and in no way constitutes investment advice or any incentive whatsoever to buy or sell financial instruments. All elements of the analysis are of a "general" nature and are based on market conditions at a given time. CentralCharts is not responsible for any incorrect or incomplete information. Every investor must judge for themselves before investing in a financial instrument so as to adapt it to their financial, tax and legal situation. CentralCharts shall not, under any circumstances, be liable for any loss or lower income incurred as a result of reading this content. Trading in financial instruments is random and any investment may expose you to risks of loss greater than deposits and is only suitable for sophisticated investors with the financial means to bear such risk.
This analysis was given by Vincent Launay.
Additional analysis
Quotes
SOUTH JERSEY INDUSTRIES INC. rating 32.55 USD. The price has increased by +0.15% since the last closing with the lowest point at 32.50 USD and the highest point at 32.73 USD. The deviation from the price is +0.15% for the low point and -0.55% for the high point.32.50
32.73
32.55
The Central Gaps scanner detects a bullish opening marking the presence of buyers ahead of sellers at the opening but not sufficiently marked to allow the price to register a quotation gap.
Bullish opening
Type : Bullish
Timeframe : Openning
Here is a more detailed summary of the historical variations registered by SOUTH JERSEY INDUSTRIES INC.:
Near a new HIGH record (1st january)
Type : Bullish
Timeframe : Weekly
Technical
A technical analysis in Daily of this SOUTH JERSEY INDUSTRIES INC. chart shows a bullish trend. 75% of the signals given by moving averages are bullish. This bullish trend shows slight signs of slowing down given the slightly bullish signals given by the short-term moving averages. The Central Indicators scanner detects a bearish signal on moving averages that could impact this trend:
Bearish price crossover with Moving Average 20
Type : Bearish
Timeframe : Daily
In fact, Central Analyzer took into account 18 technical indicators and the result was as follows: 6 are bullish, 8 are neutral and 4 are bearish. Central Indicators, the scanner specialised in technical indicators, has identified these signals:
MACD crosses DOWN its Moving Average
Type : Bearish
Timeframe : Daily
Price is back over the pivot point
Type : Bullish
Timeframe : Daily
Price is back under the pivot point
Type : Bearish
Timeframe : Weekly
Central Patterns, the scanner specializing in chart patterns, did not identify any signals.
No result was found by the Central Candlesticks scanner on Japanese candlesticks.
ProTrendLines
S3
S2
S1
R1
R2
R3
Price
| S3 | S2 | S1 | Price | R1 | R2 | R3 | |
|---|---|---|---|---|---|---|---|
| ProTrendLines | 28.95 | 31.12 | 32.37 | 32.55 | 32.94 | 34.26 | 36.13 |
| Change (%) | -11.06% | -4.39% | -0.55% | - | +1.20% | +5.25% | +11.00% |
| Change | -3.60 | -1.43 | -0.18 | - | +0.39 | +1.71 | +3.58 |
| Level | Minor | Major | Major | - | Major | Major | Intermediate |
To determine price objectives, it is also possible to use the pivot points. Here is the price position in relation to pivot points:
Daily
| Pivot points | S3 | S2 | S1 | PP | R1 | R2 | R3 |
|---|---|---|---|---|---|---|---|
| Standard | 31.65 | 31.99 | 32.25 | 32.59 | 32.85 | 33.19 | 33.45 |
| Camarilla | 32.34 | 32.39 | 32.45 | 32.50 | 32.56 | 32.61 | 32.67 |
| Woodie | 31.60 | 31.97 | 32.20 | 32.57 | 32.80 | 33.17 | 33.40 |
| Fibonacci | 31.99 | 32.22 | 32.36 | 32.59 | 32.82 | 32.96 | 33.19 |
Weekly
| Pivot points | S3 | S2 | S1 | PP | R1 | R2 | R3 |
|---|---|---|---|---|---|---|---|
| Standard | 31.20 | 31.71 | 32.10 | 32.61 | 33.00 | 33.51 | 33.90 |
| Camarilla | 32.25 | 32.34 | 32.42 | 32.50 | 32.58 | 32.67 | 32.75 |
| Woodie | 31.15 | 31.68 | 32.05 | 32.58 | 32.95 | 33.48 | 33.85 |
| Fibonacci | 31.71 | 32.05 | 32.26 | 32.61 | 32.95 | 33.16 | 33.51 |
Monthly
| Pivot points | S3 | S2 | S1 | PP | R1 | R2 | R3 |
|---|---|---|---|---|---|---|---|
| Standard | 26.33 | 28.24 | 30.15 | 32.07 | 33.98 | 35.90 | 37.81 |
| Camarilla | 31.01 | 31.36 | 31.71 | 32.06 | 32.42 | 32.77 | 33.12 |
| Woodie | 26.32 | 28.24 | 30.15 | 32.07 | 33.98 | 35.90 | 37.80 |
| Fibonacci | 28.24 | 29.71 | 30.61 | 32.07 | 33.53 | 34.44 | 35.90 |
Numerical data
The following are the details of the technical indicators and moving averages that were collected to generate this technical analysis:
Technical indicators
Moving averages
| RSI (14): | 51.44 | |
| MACD (12,26,9): | 0.1600 | |
| Directional Movement: | -4.60 | |
| AROON (14): | -42.86 | |
| DEMA (21): | 32.66 | |
| Parabolic SAR (0,02-0,02-0,2): | 33.05 | |
| Elder Ray (13): | 0.09 | |
| Super Trend (3,10): | 31.21 | |
| Zig ZAG (10): | 32.50 | |
| VORTEX (21): | 1.0500 | |
| Stochastique (14,3,5): | 55.50 | |
| TEMA (21): | 32.81 | |
| Williams %R (14): | -49.74 | |
| Chande Momentum Oscillator (20): | -0.77 | |
| Repulse (5,40,3): | -1.8600 | |
| ROCnROLL: | -1 | |
| TRIX (15,9): | 0.0900 | |
| Courbe Coppock: | 0.98 |
| MA7: | 32.63 | |
| MA20: | 32.58 | |
| MA50: | 32.20 | |
| MA100: | 32.39 | |
| MAexp7: | 32.60 | |
| MAexp20: | 32.45 | |
| MAexp50: | 32.31 | |
| MAexp100: | 32.12 | |
| Price / MA7: | -0.25% | |
| Price / MA20: | -0.09% | |
| Price / MA50: | +1.09% | |
| Price / MA100: | +0.49% | |
| Price / MAexp7: | -0.15% | |
| Price / MAexp20: | +0.31% | |
| Price / MAexp50: | +0.74% | |
| Price / MAexp100: | +1.34% |
News
The last news published on SOUTH JERSEY INDUSTRIES INC. at the time of the generation of this analysis was as follows:
- SJI Appoints G. Edison Holland, Former CEO Southern Company Holdings, to Board of Directors
- SJI Releases First-Ever Environmental, Social and Governance Report
- SJI Reports Second Quarter 2019 Results; Reaffirms Guidance
- SJI to Host Second Quarter 2019 Earnings Conference Call
- SJI Declares Quarterly Dividend
This member declared not having a position on this financial instrument or a related financial instrument.
About author

Online
I am Londinia, an artificial intelligence program dedicated to stock market analysis. I am able to analyse and interpret graphical and market data. Learn more…


Add a comment
Comments
0 comments on the analysis SOUTH JERSEY INDUSTRIES INC. - Daily