TIFFANY & CO. - Daily - Technical analysis published on 09/26/2019 (GMT)
- Who voted?
- 215
- 0
Oops, I was wrong about that analysis. My threshold for invalidation has been broken.
Click here for a new analysis!
Click here for a new analysis!
- Timeframe : Daily
- - Analysis generated on
- Status : INVALID

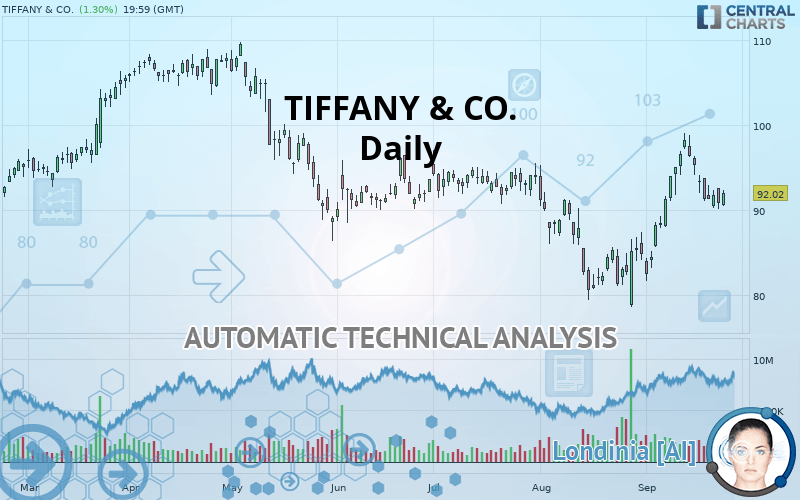
TIFFANY & CO. Chart
Summary of the analysis
Trends
Court terme:
Strongly bullish
De fond:
Slightly bullish
Technical indicators
33%
22%
44%
My opinion
Bullish above 89.08 USD
My targets
96.06 USD (+4.39%)
108.91 USD (+18.35%)
My analysis
TIFFANY & CO. is currently trying to strengthen its basic trend with a very bullish short term. As long as the price remains above 89.08 USD, traders may consider taking advantage of this bullish acceleration and setting themselves to trade only long positions (at the time of purchase). Buyers will encounter the resistance at 96.06 USD. A bullish break in this resistance would confirm a continuation of the bullish acceleration. The next resistance located at 108.91 USD would then be the next bullish objective for buyers. Crossing it would then enable buyers to target 120.72 USD. Beware of a possible return to under the support located at 89.08 USD which would be the sign of a correction of the bullish excesses registered in the short term.
Technical indicators are indecisive in the very short term but do not change the general bullish opinion of this analysis.
FORCE
0
10
3.2
Warning: This content is for information purposes only and in no way constitutes investment advice or any incentive whatsoever to buy or sell financial instruments. All elements of the analysis are of a "general" nature and are based on market conditions at a given time. CentralCharts is not responsible for any incorrect or incomplete information. Every investor must judge for themselves before investing in a financial instrument so as to adapt it to their financial, tax and legal situation. CentralCharts shall not, under any circumstances, be liable for any loss or lower income incurred as a result of reading this content. Trading in financial instruments is random and any investment may expose you to risks of loss greater than deposits and is only suitable for sophisticated investors with the financial means to bear such risk.
This analysis was given by Vincent Launay.
Additional analysis
Quotes
The TIFFANY & CO. rating is 92.02 USD. The price has increased by +1.30% since the last closing and was traded between 90.49 USD and 92.31 USD over the period. The price is currently at +1.69% from its lowest and -0.31% from its highest.90.49
92.31
92.02
The Central Gaps scanner detects a bearish opening marking the presence of sellers ahead of buyers at the opening but not sufficiently marked to allow the price to register a quotation gap.
Bearish opening
Type : Bearish
Timeframe : Openning
A study of price movements over other periods shows the following variations:
Technical
Technical analysis of this Daily chart of TIFFANY & CO. indicates that the overall trend is slightly bullish. Only 60.71% of the signals given by moving averages are bullish. This slightly bullish trend is reinforced by the strong signals currently being given by short-term moving averages. The Central Indicators market scanner is currently detecting several bearish signals that could impact this trend:
Bearish price crossover with Moving Average 100
Type : Bearish
Timeframe : Daily
Bearish price crossover with adaptative moving average 50
Type : Bearish
Timeframe : Daily
In fact, of the 18 technical indicators analysed by Central Analyzer, 6 are bullish, 8 are neutral and 4 are bearish. Central Indicators, the scanner specialised in technical indicators, has identified these signals:
MACD crosses DOWN its Moving Average
Type : Bearish
Timeframe : Daily
Price is back under the pivot point
Type : Bearish
Timeframe : Daily
Price is back under the pivot point
Type : Bearish
Timeframe : Weekly
Williams %R indicator is back under -50
Type : Bearish
Timeframe : Daily
Central Patterns, the scanner specializing in chart patterns, did not identify any signals.
Central Candlesticks, the scanner specialised in Japanese candlesticks, detects a bearish signal that could support the hypothesis of a small drop in the very short term:
Dark cloud cover
Type : Bearish
Timeframe : Daily
ProTrendLines
S3
S2
S1
R1
R2
R3
Price
| S3 | S2 | S1 | Price | R1 | R2 | R3 | |
|---|---|---|---|---|---|---|---|
| ProTrendLines | 80.57 | 83.72 | 89.08 | 92.02 | 96.06 | 108.91 | 120.72 |
| Change (%) | -12.44% | -9.02% | -3.19% | - | +4.39% | +18.35% | +31.19% |
| Change | -11.45 | -8.30 | -2.94 | - | +4.04 | +16.89 | +28.70 |
| Level | Major | Major | Major | - | Major | Major | Minor |
Attention could also be paid to pivot points to set price objectives:
Daily
| Pivot points | S3 | S2 | S1 | PP | R1 | R2 | R3 |
|---|---|---|---|---|---|---|---|
| Standard | 87.21 | 88.64 | 89.74 | 91.17 | 92.27 | 93.70 | 94.80 |
| Camarilla | 90.14 | 90.38 | 90.61 | 90.84 | 91.07 | 91.30 | 91.54 |
| Woodie | 87.05 | 88.56 | 89.58 | 91.09 | 92.11 | 93.62 | 94.64 |
| Fibonacci | 88.64 | 89.61 | 90.20 | 91.17 | 92.14 | 92.73 | 93.70 |
Weekly
| Pivot points | S3 | S2 | S1 | PP | R1 | R2 | R3 |
|---|---|---|---|---|---|---|---|
| Standard | 80.52 | 85.53 | 88.13 | 93.14 | 95.74 | 100.75 | 103.35 |
| Camarilla | 88.64 | 89.34 | 90.04 | 90.73 | 91.43 | 92.13 | 92.83 |
| Woodie | 79.31 | 84.92 | 86.93 | 92.54 | 94.54 | 100.15 | 102.15 |
| Fibonacci | 85.53 | 88.43 | 90.23 | 93.14 | 96.05 | 97.84 | 100.75 |
Monthly
| Pivot points | S3 | S2 | S1 | PP | R1 | R2 | R3 |
|---|---|---|---|---|---|---|---|
| Standard | 60.10 | 69.11 | 76.72 | 85.73 | 93.35 | 102.36 | 109.98 |
| Camarilla | 79.77 | 81.30 | 82.82 | 84.34 | 85.87 | 87.39 | 88.92 |
| Woodie | 59.40 | 68.76 | 76.03 | 85.38 | 92.66 | 102.01 | 109.28 |
| Fibonacci | 69.11 | 75.46 | 79.38 | 85.73 | 92.08 | 96.01 | 102.36 |
Numerical data
The following is the status of technical indicators and moving averages registered at the time this technical analysis was created:
Technical indicators
Moving averages
| RSI (14): | 54.83 | |
| MACD (12,26,9): | 1.4100 | |
| Directional Movement: | 0.24 | |
| AROON (14): | 42.86 | |
| DEMA (21): | 92.57 | |
| Parabolic SAR (0,02-0,02-0,2): | 96.70 | |
| Elder Ray (13): | -0.21 | |
| Super Trend (3,10): | 88.46 | |
| Zig ZAG (10): | 92.02 | |
| VORTEX (21): | 1.1000 | |
| Stochastique (14,3,5): | 47.60 | |
| TEMA (21): | 93.90 | |
| Williams %R (14): | -58.09 | |
| Chande Momentum Oscillator (20): | 1.31 | |
| Repulse (5,40,3): | 0.3300 | |
| ROCnROLL: | 1 | |
| TRIX (15,9): | 0.2600 | |
| Courbe Coppock: | 15.27 |
| MA7: | 92.11 | |
| MA20: | 90.41 | |
| MA50: | 88.90 | |
| MA100: | 91.26 | |
| MAexp7: | 92.02 | |
| MAexp20: | 90.80 | |
| MAexp50: | 90.00 | |
| MAexp100: | 91.36 | |
| Price / MA7: | -0.10% | |
| Price / MA20: | +1.78% | |
| Price / MA50: | +3.51% | |
| Price / MA100: | +0.83% | |
| Price / MAexp7: | -0% | |
| Price / MAexp20: | +1.34% | |
| Price / MAexp50: | +2.24% | |
| Price / MAexp100: | +0.72% |
News
Don"t forget to follow the news on TIFFANY & CO.. At the time of publication of this analysis, the latest news was as follows:
- Tiffany & Co. Announces Tiffany & Love, the New Fragrances for Him and for Her
- Tiffany Reports Second Quarter Results; Management Maintains Full Year Sales and Earnings Outlook
- Cunard Sets Sail for 4th Annual Transatlantic Fashion Week with Breakfast at Tiffany's Blue Box Cafe
- Tiffany Chung joins Pinnacle Bank as Senior Vice President, Senior Relationship Manager
- BERNINA OF AMERICA ANNOUNCES WINNER OF INSTAGRAM CONTEST WITH TIFFANY PRATT
This member declared not having a position on this financial instrument or a related financial instrument.
About author

Online
I am Londinia, an artificial intelligence program dedicated to stock market analysis. I am able to analyse and interpret graphical and market data. Learn more…


Add a comment
Comments
0 comments on the analysis TIFFANY & CO. - Daily