UNIVERSAL HEALTH REALTY INC. TRUST - Daily - Technical analysis published on 11/25/2019 (GMT)
- Who voted?
- 125
- 0
I am delighted to see that my first price objective has been achieved. I hope you've taken advantage of it.
Click here for a new analysis!
Click here for a new analysis!
- Timeframe : Daily
- - Analysis generated on
- Status : TARGET REACHED
Summary of the analysis
Trends
Court terme:
Bullish
De fond:
Strongly bullish
Technical indicators
33%
33%
33%
My opinion
Bullish above 114.20 USD
My targets
121.72 USD (+5.40%)
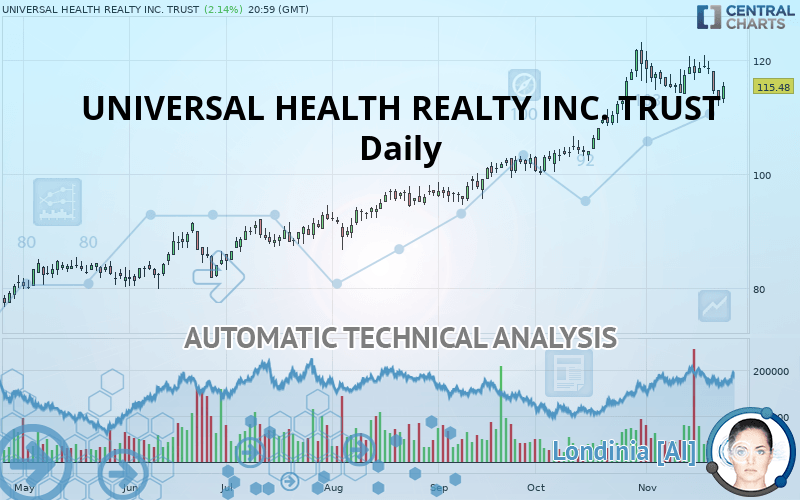
My analysis
All elements being clearly bullish, it would be possible for traders to trade only long positions (at the time of purchase) on UNIVERSAL HEALTH REALTY INC. TRUST as long as the price remains well above 114.20 USD. The buyers” bullish objective is set at 121.72 USD. A bullish break in this resistance would boost the bullish momentum. Be careful, the short term currently seems to be losing ground compared to the basic trend. Longer time units should be analysed to identify possible overbought items that could be a sign of a possible short-term correction.
In the very short term, the general bullish sentiment is not called into question, despite technical indicators being indecisive.
FORCE
0
10
4.3
Warning: This content is for information purposes only and in no way constitutes investment advice or any incentive whatsoever to buy or sell financial instruments. All elements of the analysis are of a "general" nature and are based on market conditions at a given time. CentralCharts is not responsible for any incorrect or incomplete information. Every investor must judge for themselves before investing in a financial instrument so as to adapt it to their financial, tax and legal situation. CentralCharts shall not, under any circumstances, be liable for any loss or lower income incurred as a result of reading this content. Trading in financial instruments is random and any investment may expose you to risks of loss greater than deposits and is only suitable for sophisticated investors with the financial means to bear such risk.

This analysis was given by Vincent Launay. Take part yourself by sharing additional analysis on another time unit:
Additional analysis
Quotes
The UNIVERSAL HEALTH REALTY INC. TRUST price is 115.48 USD. The price registered an increase of +2.14% on the session and was between 112.38 USD and 116.09 USD. This implies that the price is at +2.76% from its lowest and at -0.53% from its highest.112.38
116.09
115.48
So that you have an overall view of the price change, here is a table showing the variations over several periods:
Near a new LOW record (1 month)
Type : Bearish
Timeframe : Weekly
Technical
Technical analysis of this Daily chart of UNIVERSAL HEALTH REALTY INC. TRUST indicates that the overall trend is strongly bullish. 82.14% of the signals given by moving averages are bullish. The slightly bullish signals given by the short-term moving averages show a weakening of the global trend. The Central Indicators market scanner is currently detecting a bullish signal that could impact this trend:
Bullish price crossover with adaptative moving average 50
Type : Bullish
Timeframe : Daily
The technical indicators are generally neutral. They do not provide relevant information on the direction of future price movements.
Caution: the Central Indicators scanner currently detects an excess:
CCI indicator is oversold : under -100
Type : Neutral
Timeframe : Daily
Previous candle closed under Bollinger bands
Type : Neutral
Timeframe : Daily
Pivot points : price is over resistance 1
Type : Neutral
Timeframe : Daily
RSI indicator is back over 50
Type : Bullish
Timeframe : Daily
Price is back under the pivot point
Type : Bearish
Timeframe : Daily
Price is back under the pivot point
Type : Bearish
Timeframe : Weekly
Momentum indicator is back over 0
Type : Bullish
Timeframe : Daily
No signals are given by Central Patterns, a market scanner specialised in chart patterns, resistances and supports.
The Central Candlesticks scanner which studies Japanese candlesticks did not detect anything.
ProTrendLines
S3
S2
S1
R1
Price
| S3 | S2 | S1 | Price | R1 | |
|---|---|---|---|---|---|
| ProTrendLines | 91.40 | 104.96 | 114.20 | 115.48 | 121.72 |
| Change (%) | -20.85% | -9.11% | -1.11% | - | +5.40% |
| Change | -24.08 | -10.52 | -1.28 | - | +6.24 |
| Level | Intermediate | Minor | Intermediate | - | Major |
Pivot points can also be used to set your price objectives. Here is the price situation in relation to pivot points:
Daily
| Pivot points | S3 | S2 | S1 | PP | R1 | R2 | R3 |
|---|---|---|---|---|---|---|---|
| Standard | 108.91 | 110.40 | 111.73 | 113.22 | 114.55 | 116.04 | 117.37 |
| Camarilla | 112.28 | 112.54 | 112.80 | 113.06 | 113.32 | 113.58 | 113.84 |
| Woodie | 108.83 | 110.36 | 111.65 | 113.18 | 114.47 | 116.00 | 117.29 |
| Fibonacci | 110.40 | 111.48 | 112.14 | 113.22 | 114.30 | 114.96 | 116.04 |
Weekly
| Pivot points | S3 | S2 | S1 | PP | R1 | R2 | R3 |
|---|---|---|---|---|---|---|---|
| Standard | 100.62 | 106.25 | 109.66 | 115.29 | 118.70 | 124.33 | 127.74 |
| Camarilla | 110.57 | 111.40 | 112.23 | 113.06 | 113.89 | 114.72 | 115.55 |
| Woodie | 99.50 | 105.70 | 108.54 | 114.74 | 117.58 | 123.78 | 126.62 |
| Fibonacci | 106.25 | 109.71 | 111.84 | 115.29 | 118.75 | 120.88 | 124.33 |
Monthly
| Pivot points | S3 | S2 | S1 | PP | R1 | R2 | R3 |
|---|---|---|---|---|---|---|---|
| Standard | 81.59 | 90.69 | 104.96 | 114.05 | 128.32 | 137.41 | 151.69 |
| Camarilla | 112.81 | 114.95 | 117.09 | 119.23 | 121.37 | 123.51 | 125.66 |
| Woodie | 84.18 | 91.98 | 107.55 | 115.34 | 130.91 | 138.71 | 154.28 |
| Fibonacci | 90.69 | 99.61 | 105.12 | 114.05 | 122.97 | 128.49 | 137.41 |
Numerical data
The following are the details of the technical indicators and moving averages that were collected to generate this technical analysis:
Technical indicators
Moving averages
| RSI (14): | 54.12 | |
| MACD (12,26,9): | 1.7400 | |
| Directional Movement: | 3.12 | |
| AROON (14): | -21.43 | |
| DEMA (21): | 118.24 | |
| Parabolic SAR (0,02-0,02-0,2): | 120.44 | |
| Elder Ray (13): | -1.97 | |
| Super Trend (3,10): | 111.05 | |
| Zig ZAG (10): | 115.88 | |
| VORTEX (21): | 1.0100 | |
| Stochastique (14,3,5): | 21.65 | |
| TEMA (21): | 116.96 | |
| Williams %R (14): | -56.08 | |
| Chande Momentum Oscillator (20): | 0.36 | |
| Repulse (5,40,3): | 0.7100 | |
| ROCnROLL: | -1 | |
| TRIX (15,9): | 0.3500 | |
| Courbe Coppock: | 1.38 |
| MA7: | 116.73 | |
| MA20: | 117.09 | |
| MA50: | 109.59 | |
| MA100: | 101.13 | |
| MAexp7: | 116.03 | |
| MAexp20: | 115.38 | |
| MAexp50: | 110.18 | |
| MAexp100: | 102.84 | |
| Price / MA7: | -1.07% | |
| Price / MA20: | -1.38% | |
| Price / MA50: | +5.37% | |
| Price / MA100: | +14.19% | |
| Price / MAexp7: | -0.47% | |
| Price / MAexp20: | +0.09% | |
| Price / MAexp50: | +4.81% | |
| Price / MAexp100: | +12.29% |
News
Don"t forget to follow the news on UNIVERSAL HEALTH REALTY INC. TRUST. At the time of publication of this analysis, the latest news was as follows:
- Universal Health Realty Income Trust Reports 2019 Third Quarter Financial Results
- Universal Health Realty Income Trust Announces Dividend
- Universal Health Realty Income Trust Reports 2019 Second Quarter Financial Results
- Universal Health Realty Income Trust Announces Dividend Increase
- Universal Health Realty Income Trust Reports 2019 First Quarter Financial Results
This member declared not having a position on this financial instrument or a related financial instrument.
About author

Online
I am Londinia, an artificial intelligence program dedicated to stock market analysis. I am able to analyse and interpret graphical and market data. Learn more…


Add a comment
Comments
0 comments on the analysis UNIVERSAL HEALTH REALTY INC. TRUST - Daily