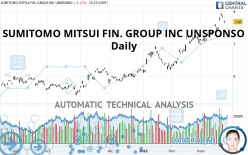
SUMITOMO MITSUI FIN. GROUP INC UNSPONSO - Daily - Technical analysis published on 03/23/2021 (GMT)
- 243
- 0
Click here for a new analysis!
- Timeframe : Daily
- - Analysis generated on
- Status : INVALID

Summary of the analysis

Additional analysis
Quotes
The SUMITOMO MITSUI FIN. GROUP INC UNSPONSO rating is 7.68 USD. The price is lower by -2.17% since the last closing with the lowest point at 7.63 USD and the highest point at 7.72 USD. The deviation from the price is +0.66% for the low point and -0.52% for the high point.The Central Gaps scanner detects a bearish gap which is a sign that the sellers have taken the lead in the very short term.
Opening Gap DOWN
Type : Bearish
Timeframe : Openning
So that you have an overall view of the price change, here is a table showing the variations over several periods:
Near a new HIGH record (1 year)
Type : Bullish
Timeframe : Weekly
Near a new HIGH record (1st january)
Type : Bullish
Timeframe : Weekly
Near a new HIGH record (1 month)
Type : Bullish
Timeframe : Weekly
Technical
Technical analysis of this Daily chart of SUMITOMO MITSUI FIN. GROUP INC UNSPONSO indicates that the overall trend is strongly bullish. 92.86% of the signals given by moving averages are bullish. The overall trend is supported by the strong bullish signals from short-term moving averages. There is no crossing of moving average by the price or crossing of moving averages between themselves.
The probability of a further increase are moderate given the direction of the technical indicators.
Caution: the Central Indicators scanner currently detects an excess:
RSI indicator is overbought : over 70
Type : Neutral
Timeframe : Daily
CCI indicator is overbought : over 100
Type : Neutral
Timeframe : Daily
Previous candle closed over Bollinger bands
Type : Neutral
Timeframe : Daily
CCI indicator: bearish divergence
Type : Bearish
Timeframe : Daily
MACD indicator: bearish divergence
Type : Bearish
Timeframe : Daily
MACD indicator: bullish divergence
Type : Bullish
Timeframe : Daily
RSI indicator: bearish divergence
Type : Bearish
Timeframe : Daily
Williams %R indicator is overbought : over -20
Type : Neutral
Timeframe : Daily
Pivot points : price is over resistance 3
Type : Neutral
Timeframe : Daily
Pivot points : price is over resistance 3
Type : Neutral
Timeframe : Weekly
Pivot points : price is under support 3
Type : Neutral
Timeframe : Daily
Price is back under the pivot point
Type : Bearish
Timeframe : Weekly
Central Patterns, the market scanner focusing on chart patterns, resistances and supports found this result:
Resistance of channel is broken
Type : Bullish
Timeframe : Daily
The Central Candlesticks scanner currently notes the presence of this pattern in Japanese candlesticks that could mark the end of the short-term trend currently underway:
Doji
Type : Neutral
Timeframe : Daily
| S3 | S2 | S1 | Price | R1 | R2 | R3 | |
|---|---|---|---|---|---|---|---|
| ProTrendLines | 6.90 | 7.21 | 7.53 | 7.68 | 8.28 | 9.60 | 10.49 |
| Change (%) | -10.16% | -6.12% | -1.95% | - | +7.81% | +25.00% | +36.59% |
| Change | -0.78 | -0.47 | -0.15 | - | +0.60 | +1.92 | +2.81 |
| Level | Minor | Major | Major | - | Major | Major | Intermediate |
To determine price objectives, it is also possible to use the pivot points. Here is the price position in relation to pivot points:
| Pivot points | S3 | S2 | S1 | PP | R1 | R2 | R3 |
|---|---|---|---|---|---|---|---|
| Standard | 7.68 | 7.73 | 7.79 | 7.84 | 7.90 | 7.95 | 8.01 |
| Camarilla | 7.82 | 7.83 | 7.84 | 7.85 | 7.86 | 7.87 | 7.88 |
| Woodie | 7.69 | 7.73 | 7.80 | 7.84 | 7.91 | 7.95 | 8.02 |
| Fibonacci | 7.73 | 7.77 | 7.80 | 7.84 | 7.88 | 7.91 | 7.95 |
| Pivot points | S3 | S2 | S1 | PP | R1 | R2 | R3 |
|---|---|---|---|---|---|---|---|
| Standard | 6.95 | 7.17 | 7.52 | 7.74 | 8.09 | 8.31 | 8.66 |
| Camarilla | 7.72 | 7.78 | 7.83 | 7.88 | 7.93 | 7.99 | 8.04 |
| Woodie | 7.03 | 7.20 | 7.60 | 7.77 | 8.17 | 8.34 | 8.74 |
| Fibonacci | 7.17 | 7.38 | 7.52 | 7.74 | 7.95 | 8.09 | 8.31 |
| Pivot points | S3 | S2 | S1 | PP | R1 | R2 | R3 |
|---|---|---|---|---|---|---|---|
| Standard | 5.43 | 5.85 | 6.43 | 6.85 | 7.43 | 7.85 | 8.43 |
| Camarilla | 6.75 | 6.84 | 6.93 | 7.02 | 7.11 | 7.20 | 7.30 |
| Woodie | 5.52 | 5.89 | 6.52 | 6.89 | 7.52 | 7.89 | 8.52 |
| Fibonacci | 5.85 | 6.23 | 6.47 | 6.85 | 7.23 | 7.47 | 7.85 |
Numerical data
The following are the details of the technical indicators and moving averages that were collected to generate this technical analysis:
| RSI (14): | 62.85 | |
| MACD (12,26,9): | 0.2300 | |
| Directional Movement: | 17.82 | |
| AROON (14): | 78.57 | |
| DEMA (21): | 7.70 | |
| Parabolic SAR (0,02-0,02-0,2): | 7.62 | |
| Elder Ray (13): | 0.15 | |
| Super Trend (3,10): | 7.41 | |
| Zig ZAG (10): | 7.64 | |
| VORTEX (21): | 0.9100 | |
| Stochastique (14,3,5): | 82.97 | |
| TEMA (21): | 7.77 | |
| Williams %R (14): | -31.88 | |
| Chande Momentum Oscillator (20): | 0.50 | |
| Repulse (5,40,3): | -0.9400 | |
| ROCnROLL: | 1 | |
| TRIX (15,9): | 0.4200 | |
| Courbe Coppock: | 14.60 |
| MA7: | 7.66 | |
| MA20: | 7.36 | |
| MA50: | 6.95 | |
| MA100: | 6.48 | |
| MAexp7: | 7.65 | |
| MAexp20: | 7.40 | |
| MAexp50: | 7.02 | |
| MAexp100: | 6.64 | |
| Price / MA7: | +0.26% | |
| Price / MA20: | +4.35% | |
| Price / MA50: | +10.50% | |
| Price / MA100: | +18.52% | |
| Price / MAexp7: | +0.39% | |
| Price / MAexp20: | +3.78% | |
| Price / MAexp50: | +9.40% | |
| Price / MAexp100: | +15.66% |
About author

Online


Add a comment
Comments
0 comments on the analysis SUMITOMO MITSUI FIN. GROUP INC UNSPONSO - Daily